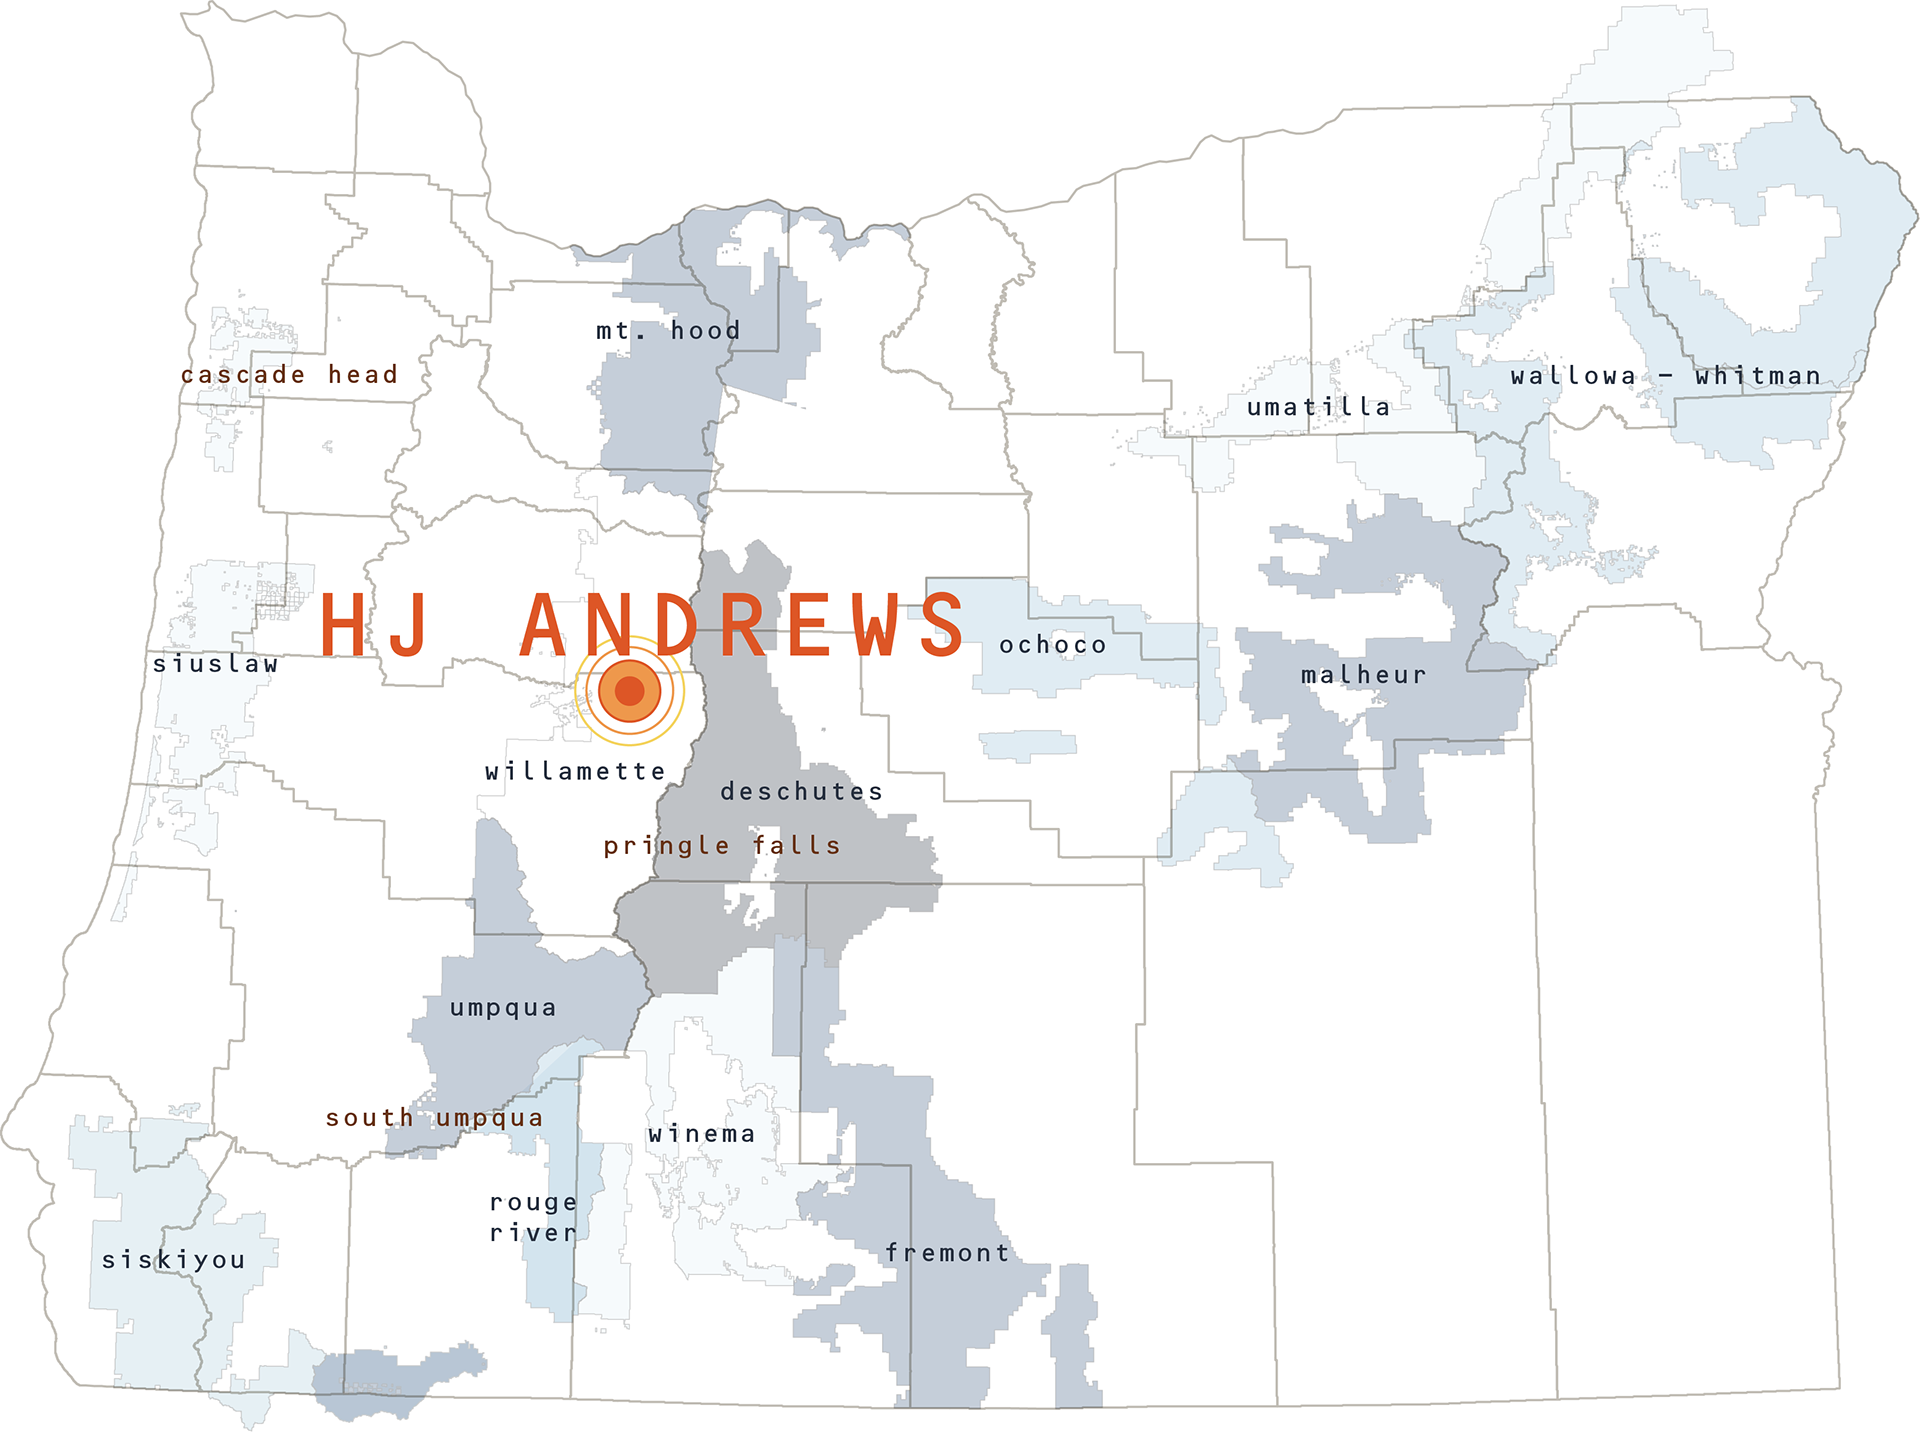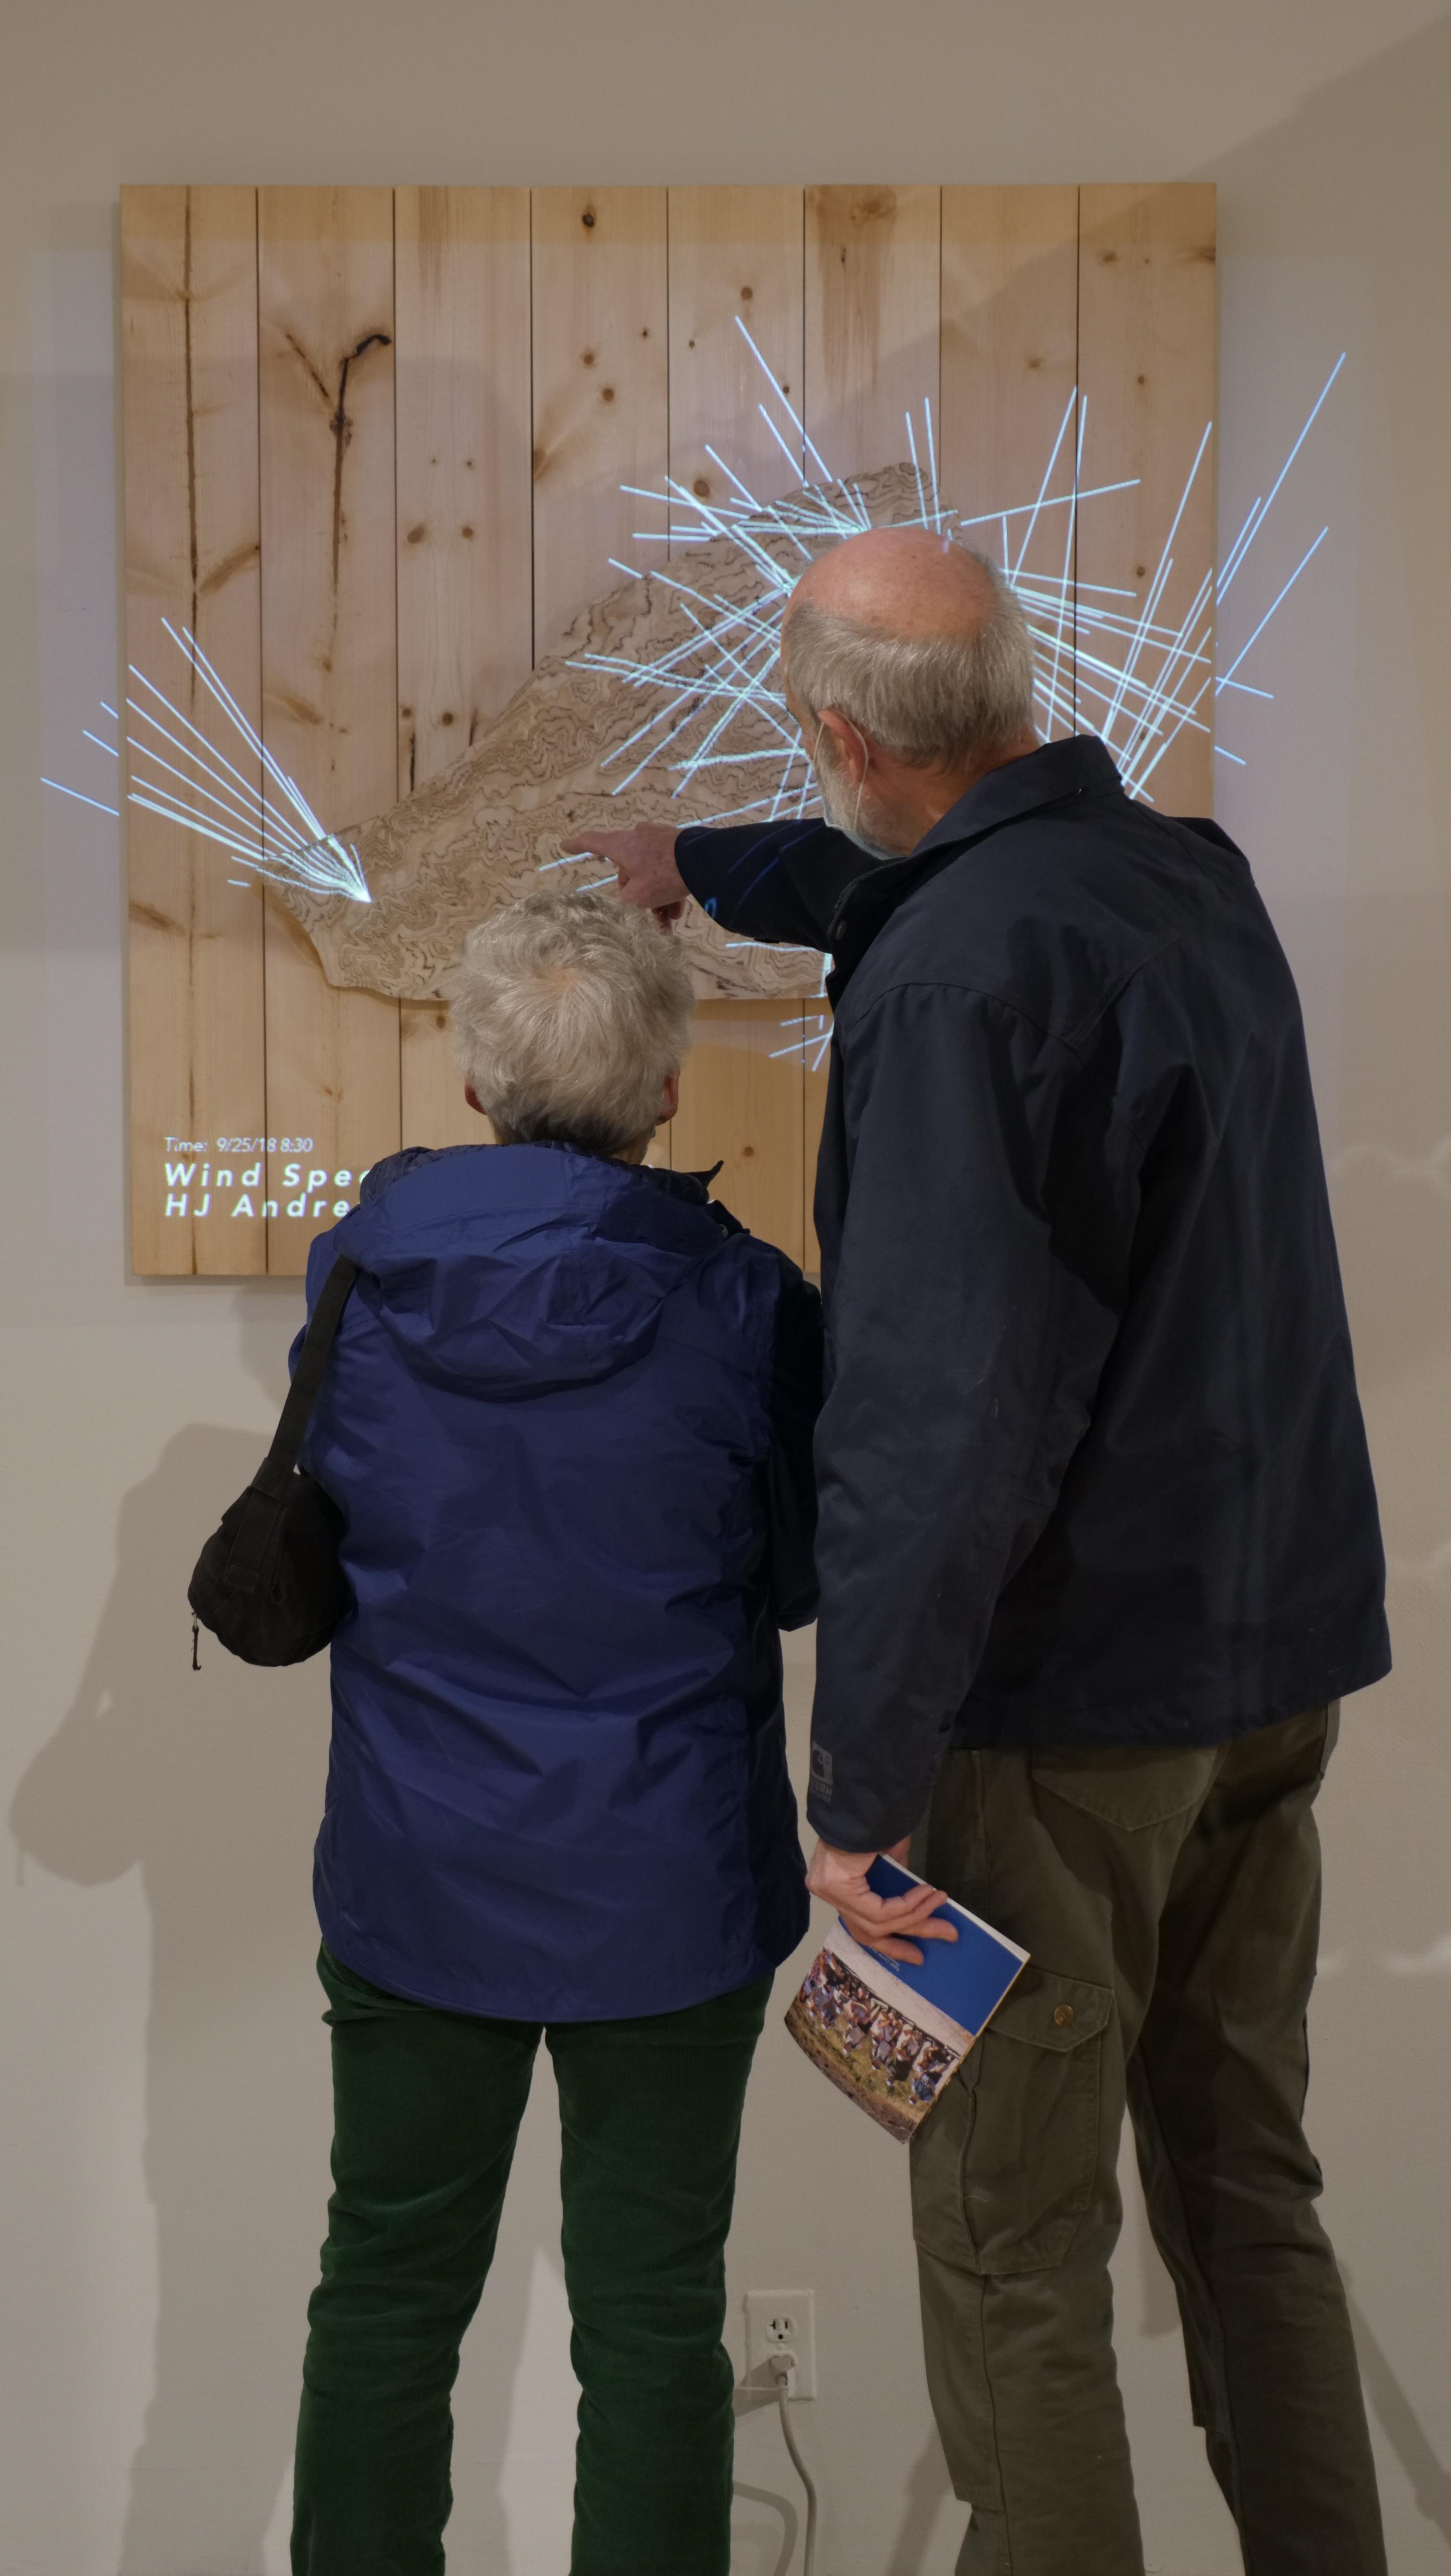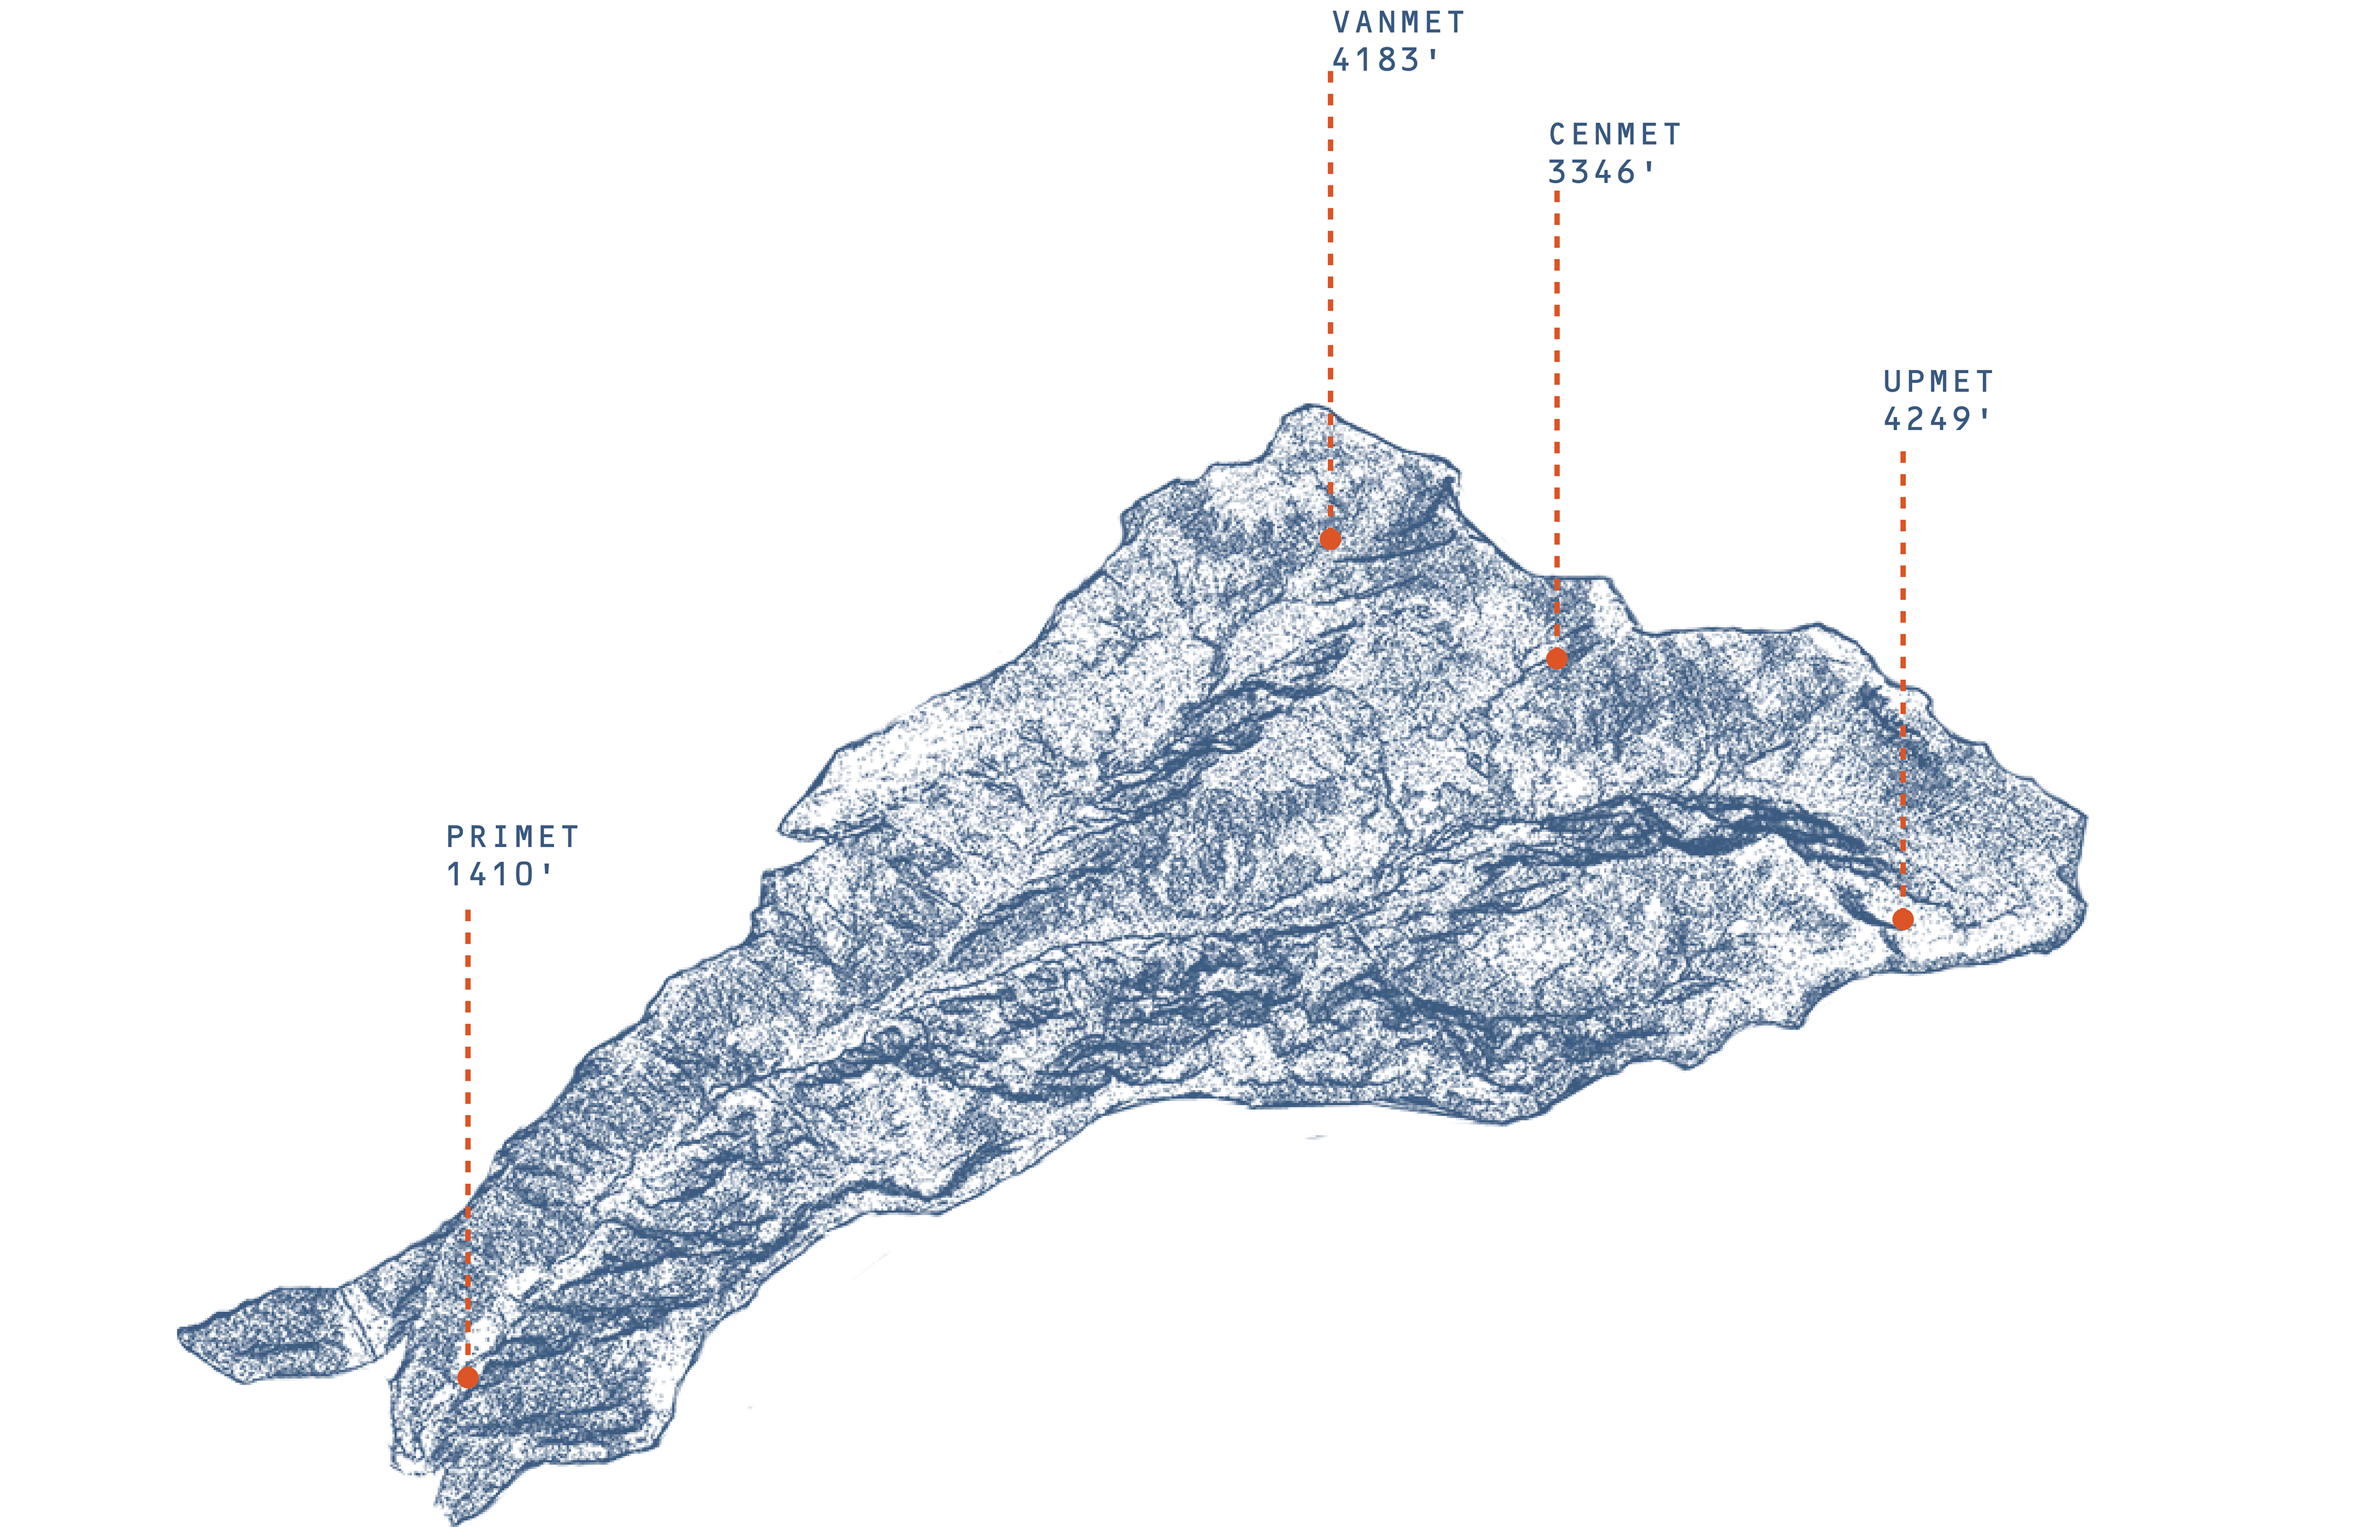
Data was collected from several meteorological (MET) stations throughout the Willamette National Forest. Then, using Processing, wind speed and directional data was converted into an animation.
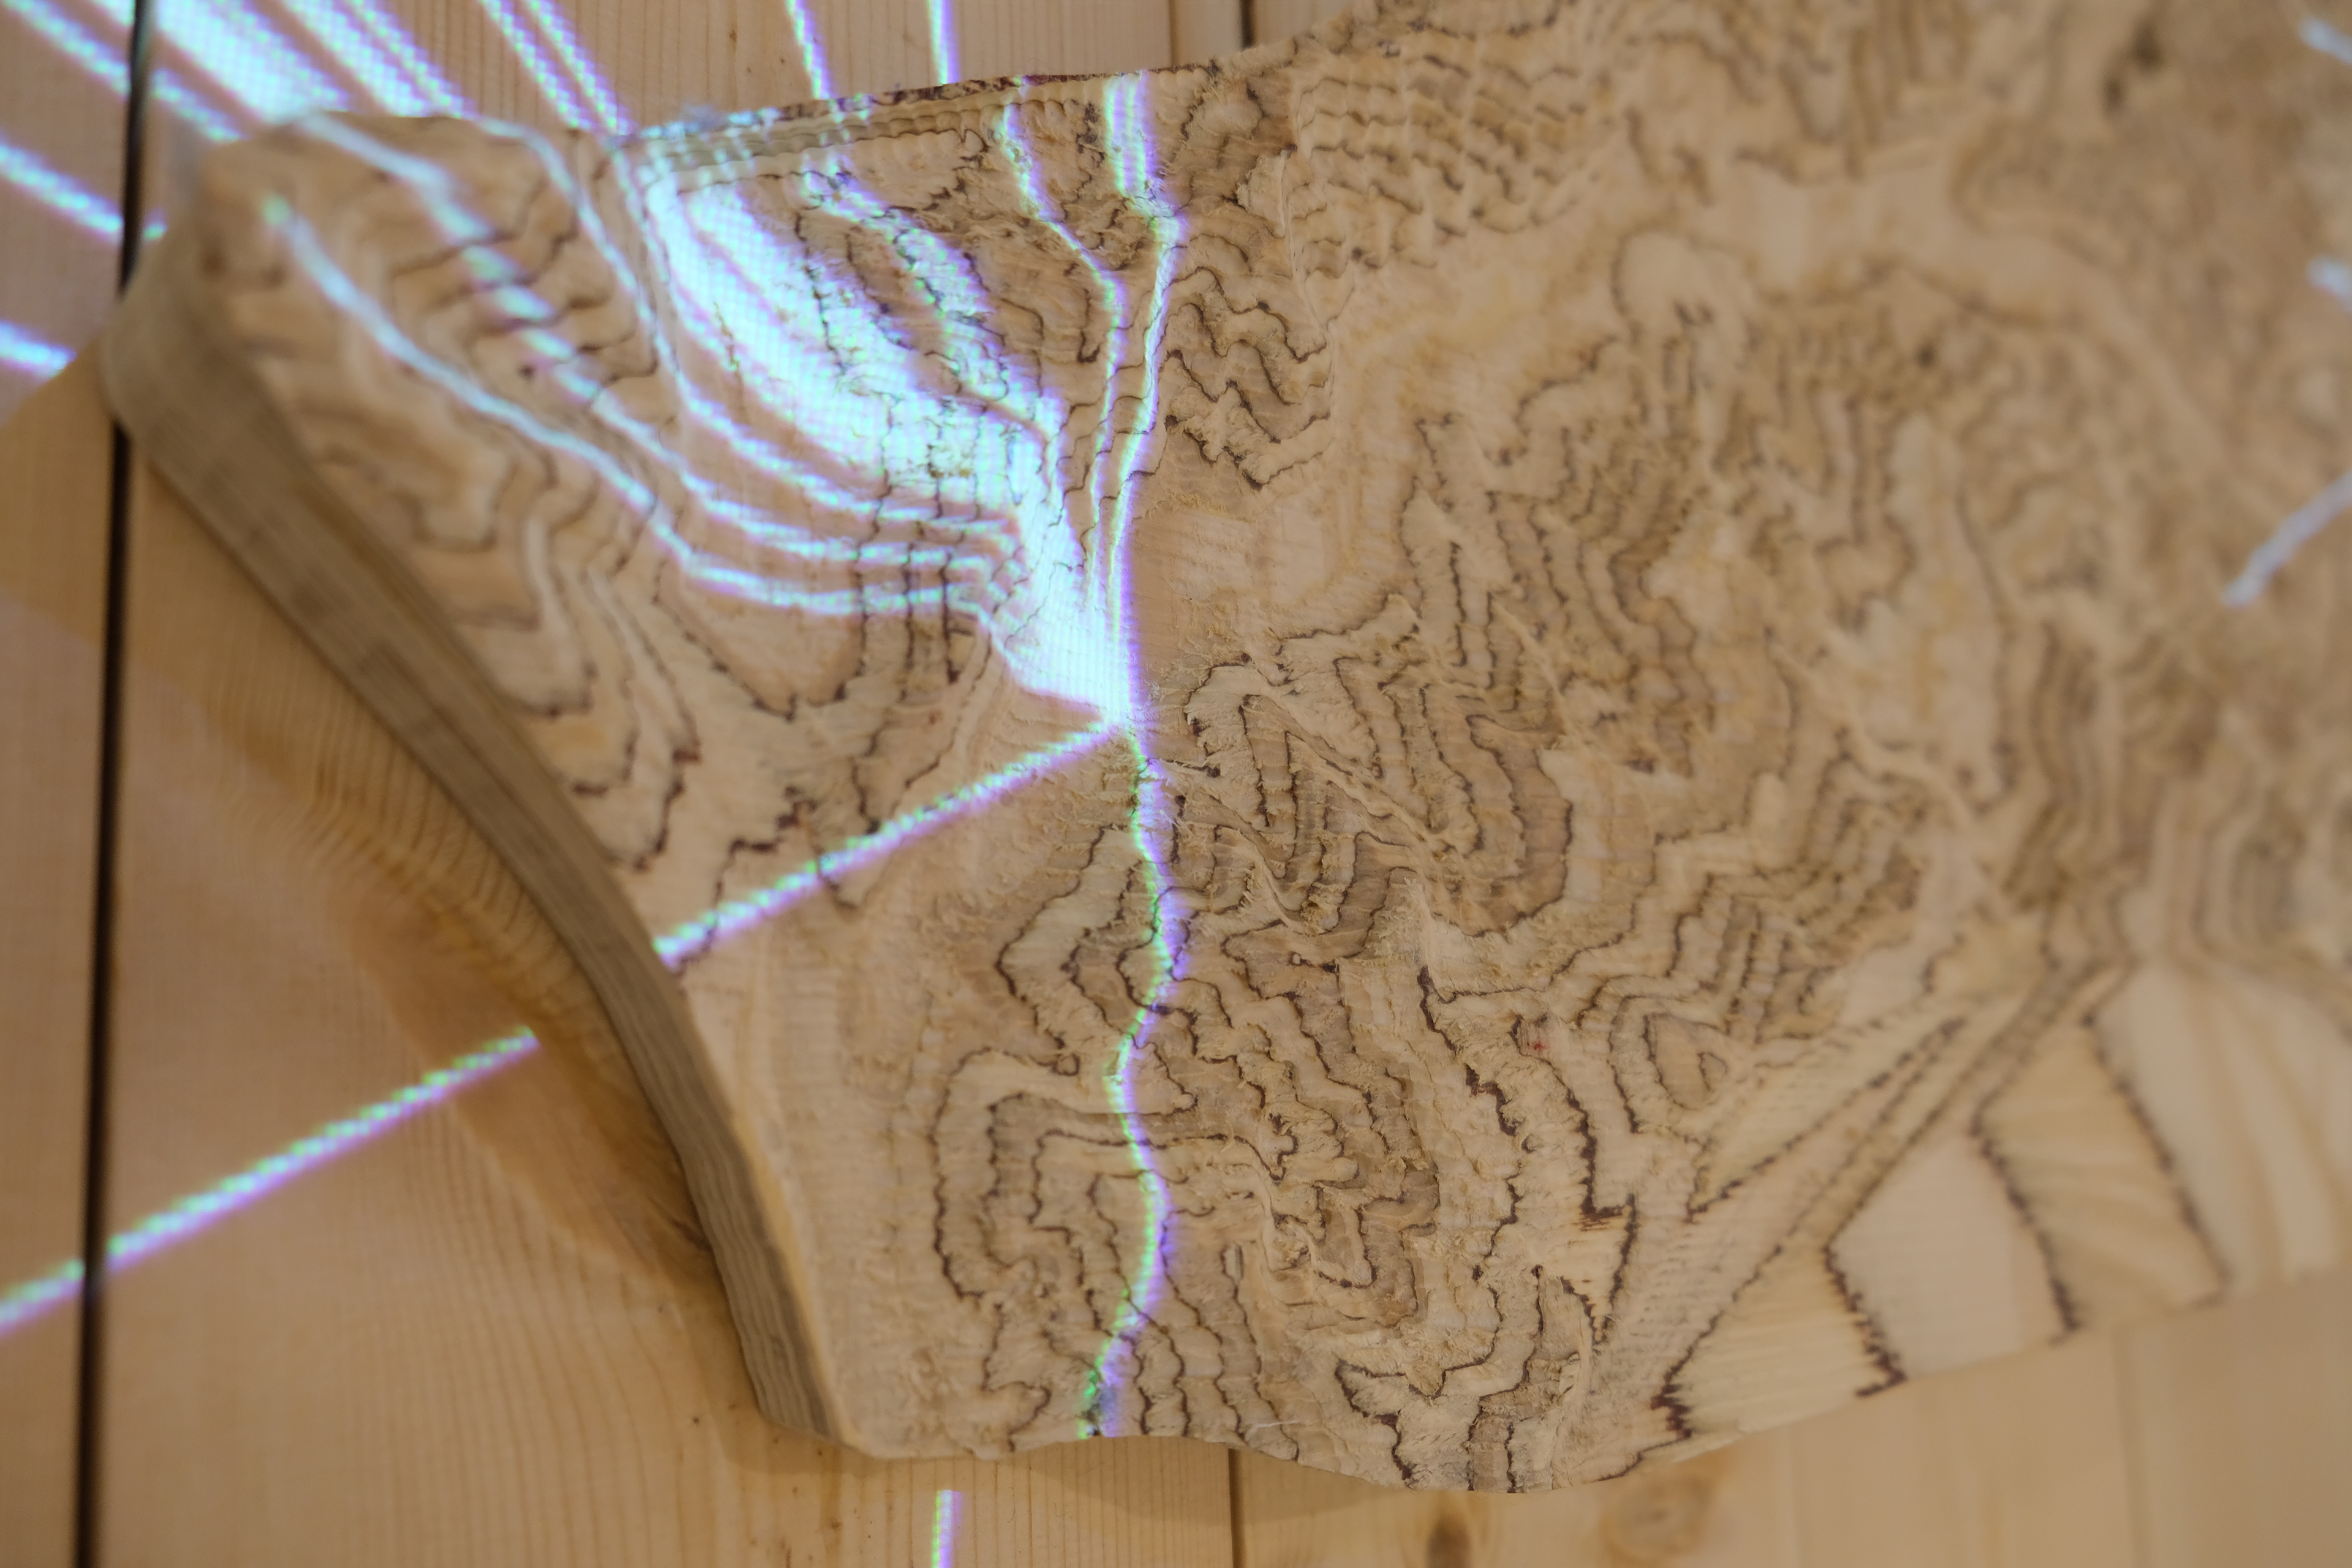
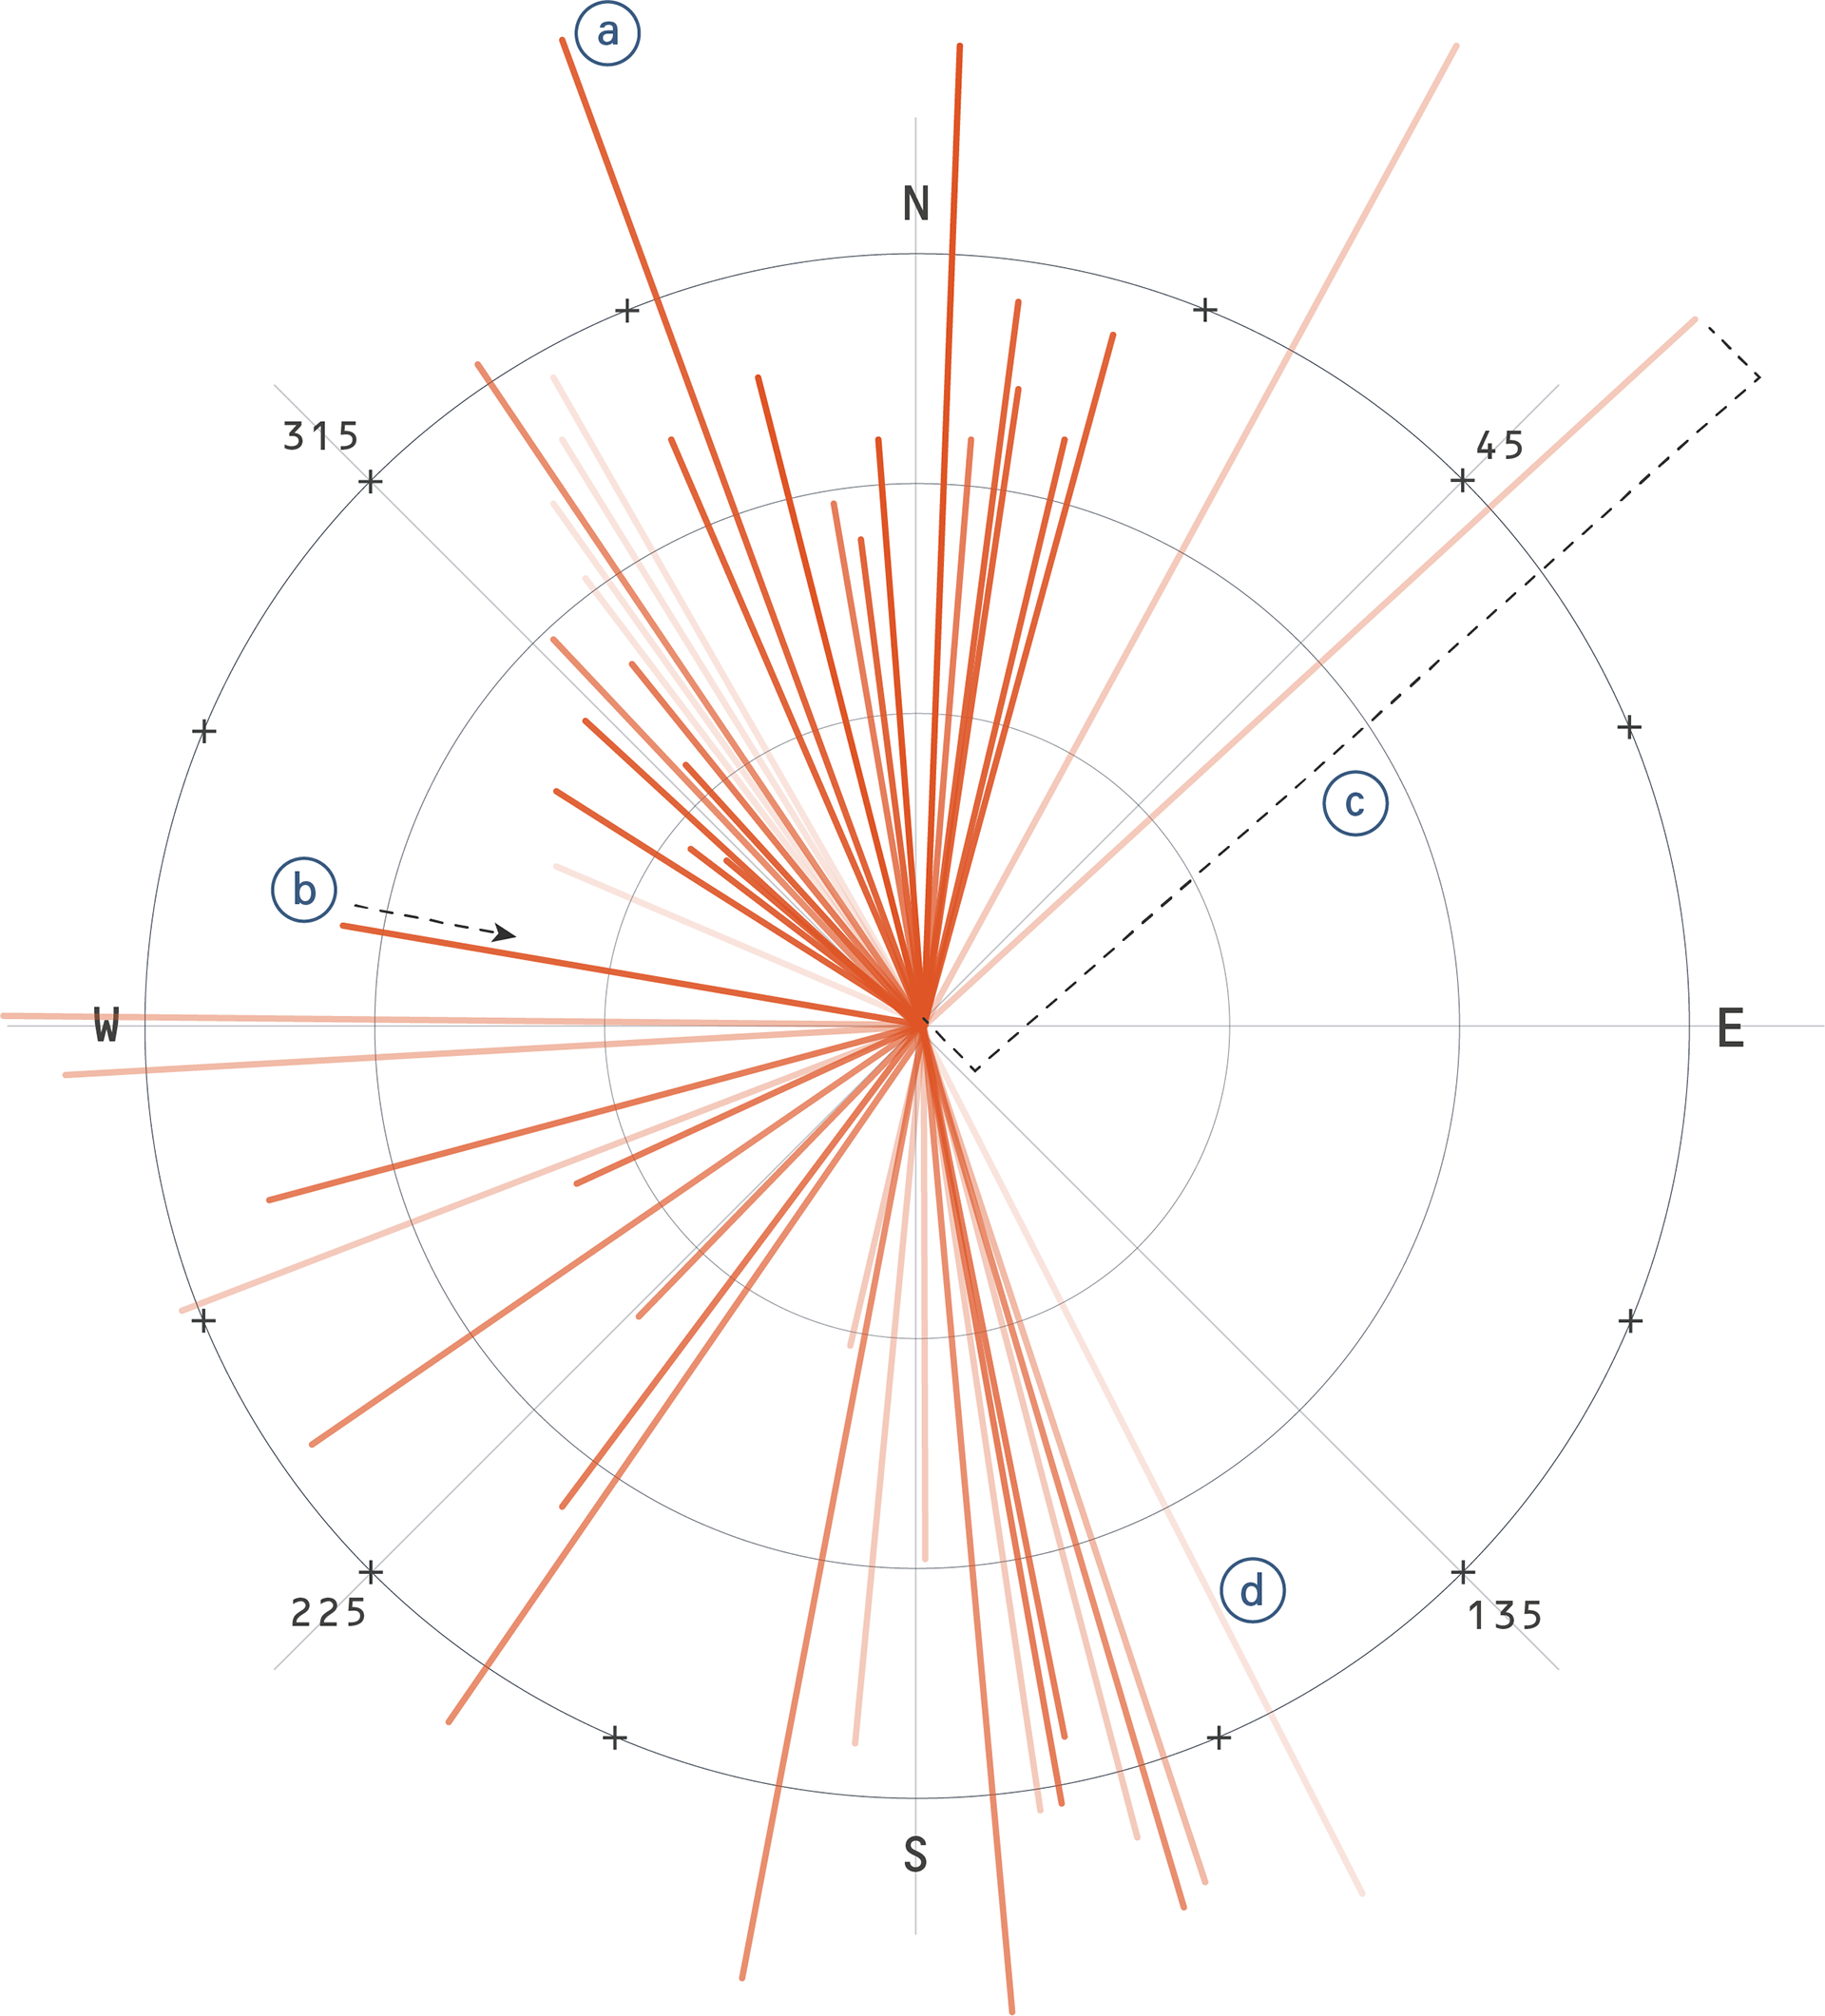
(a) A day of air movement is projected, with each line representing the average wind reading for a 30 minute interval. (b) The angle of the line represents the direction of the wind. (c) The length of the line represents the speed of the wind. (d) Older lines fade away, while newer lines appear bold.