A wildfire tower lookout’s work is equal parts landscape observation and weather reporting, punctuated by infrequent adrenaline-spiked smoke sightings. Given the direct relationship between weather and wildfire, it is not surprising that many lookout towers double as weather stations. These tower “Met” stations, so affectionately called by field ecologists, collect weather and climate data to help assess wildfire risks, and also wildfire behavior in the event of a blow up.
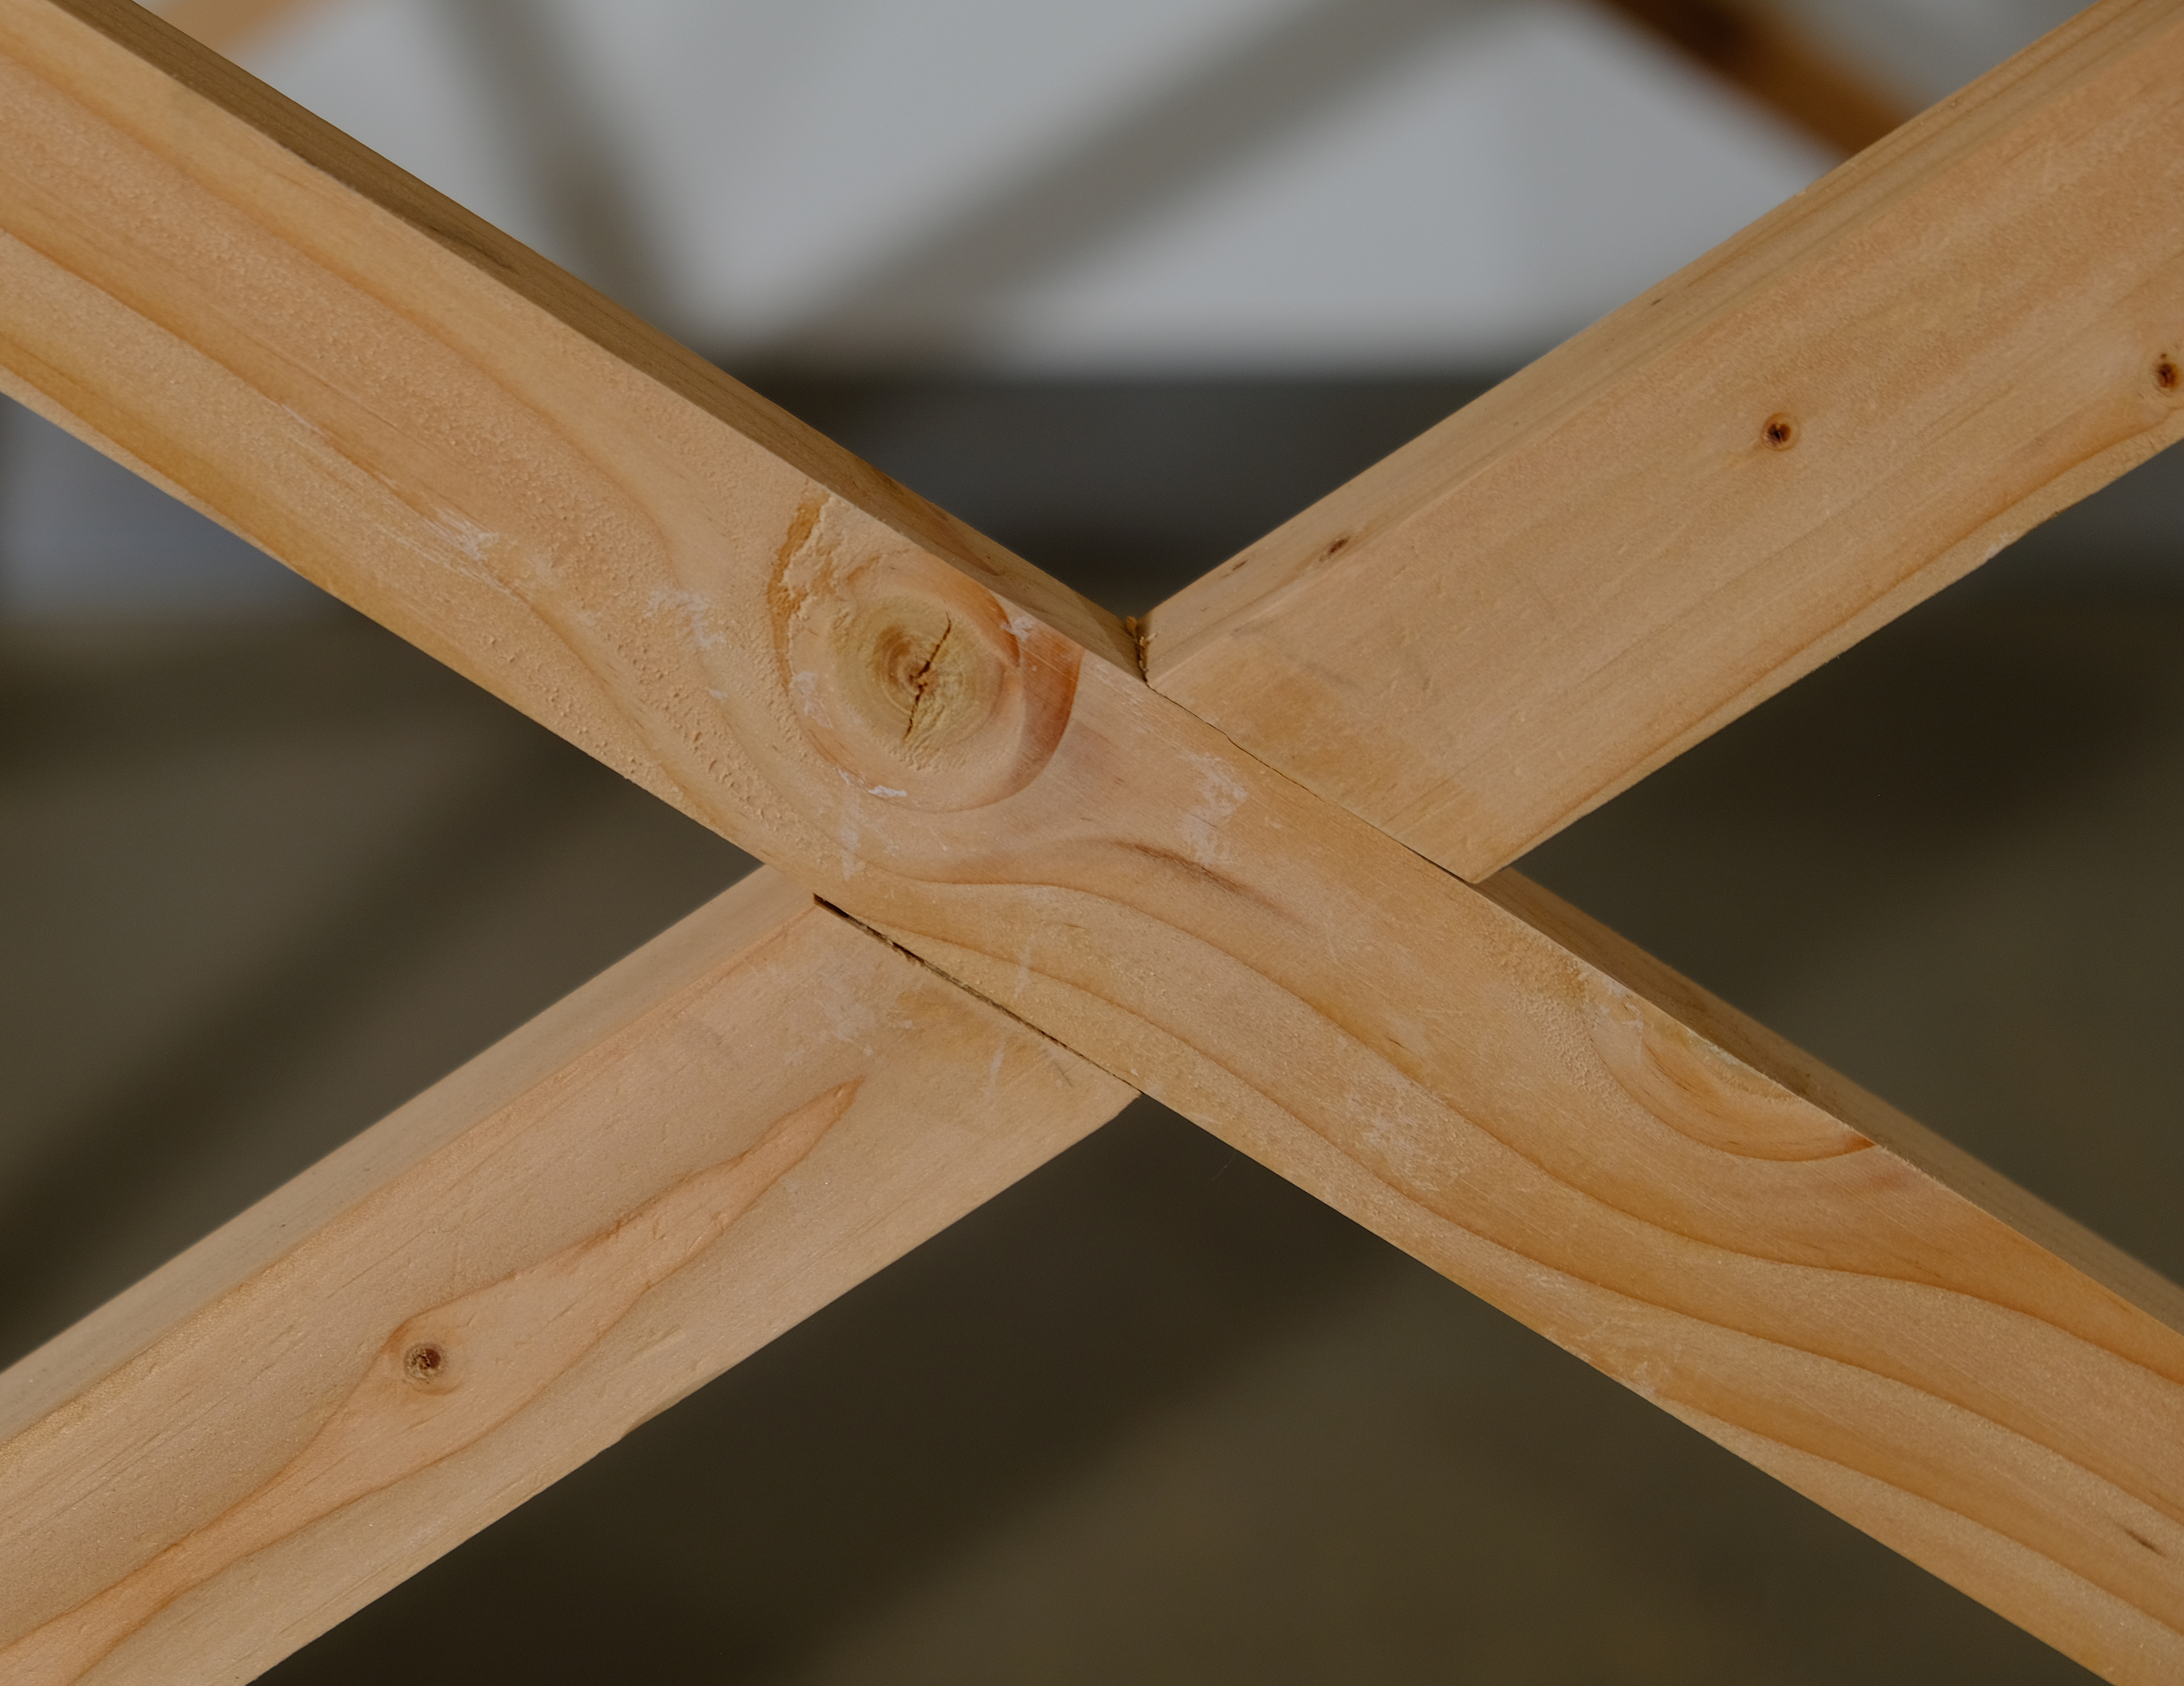
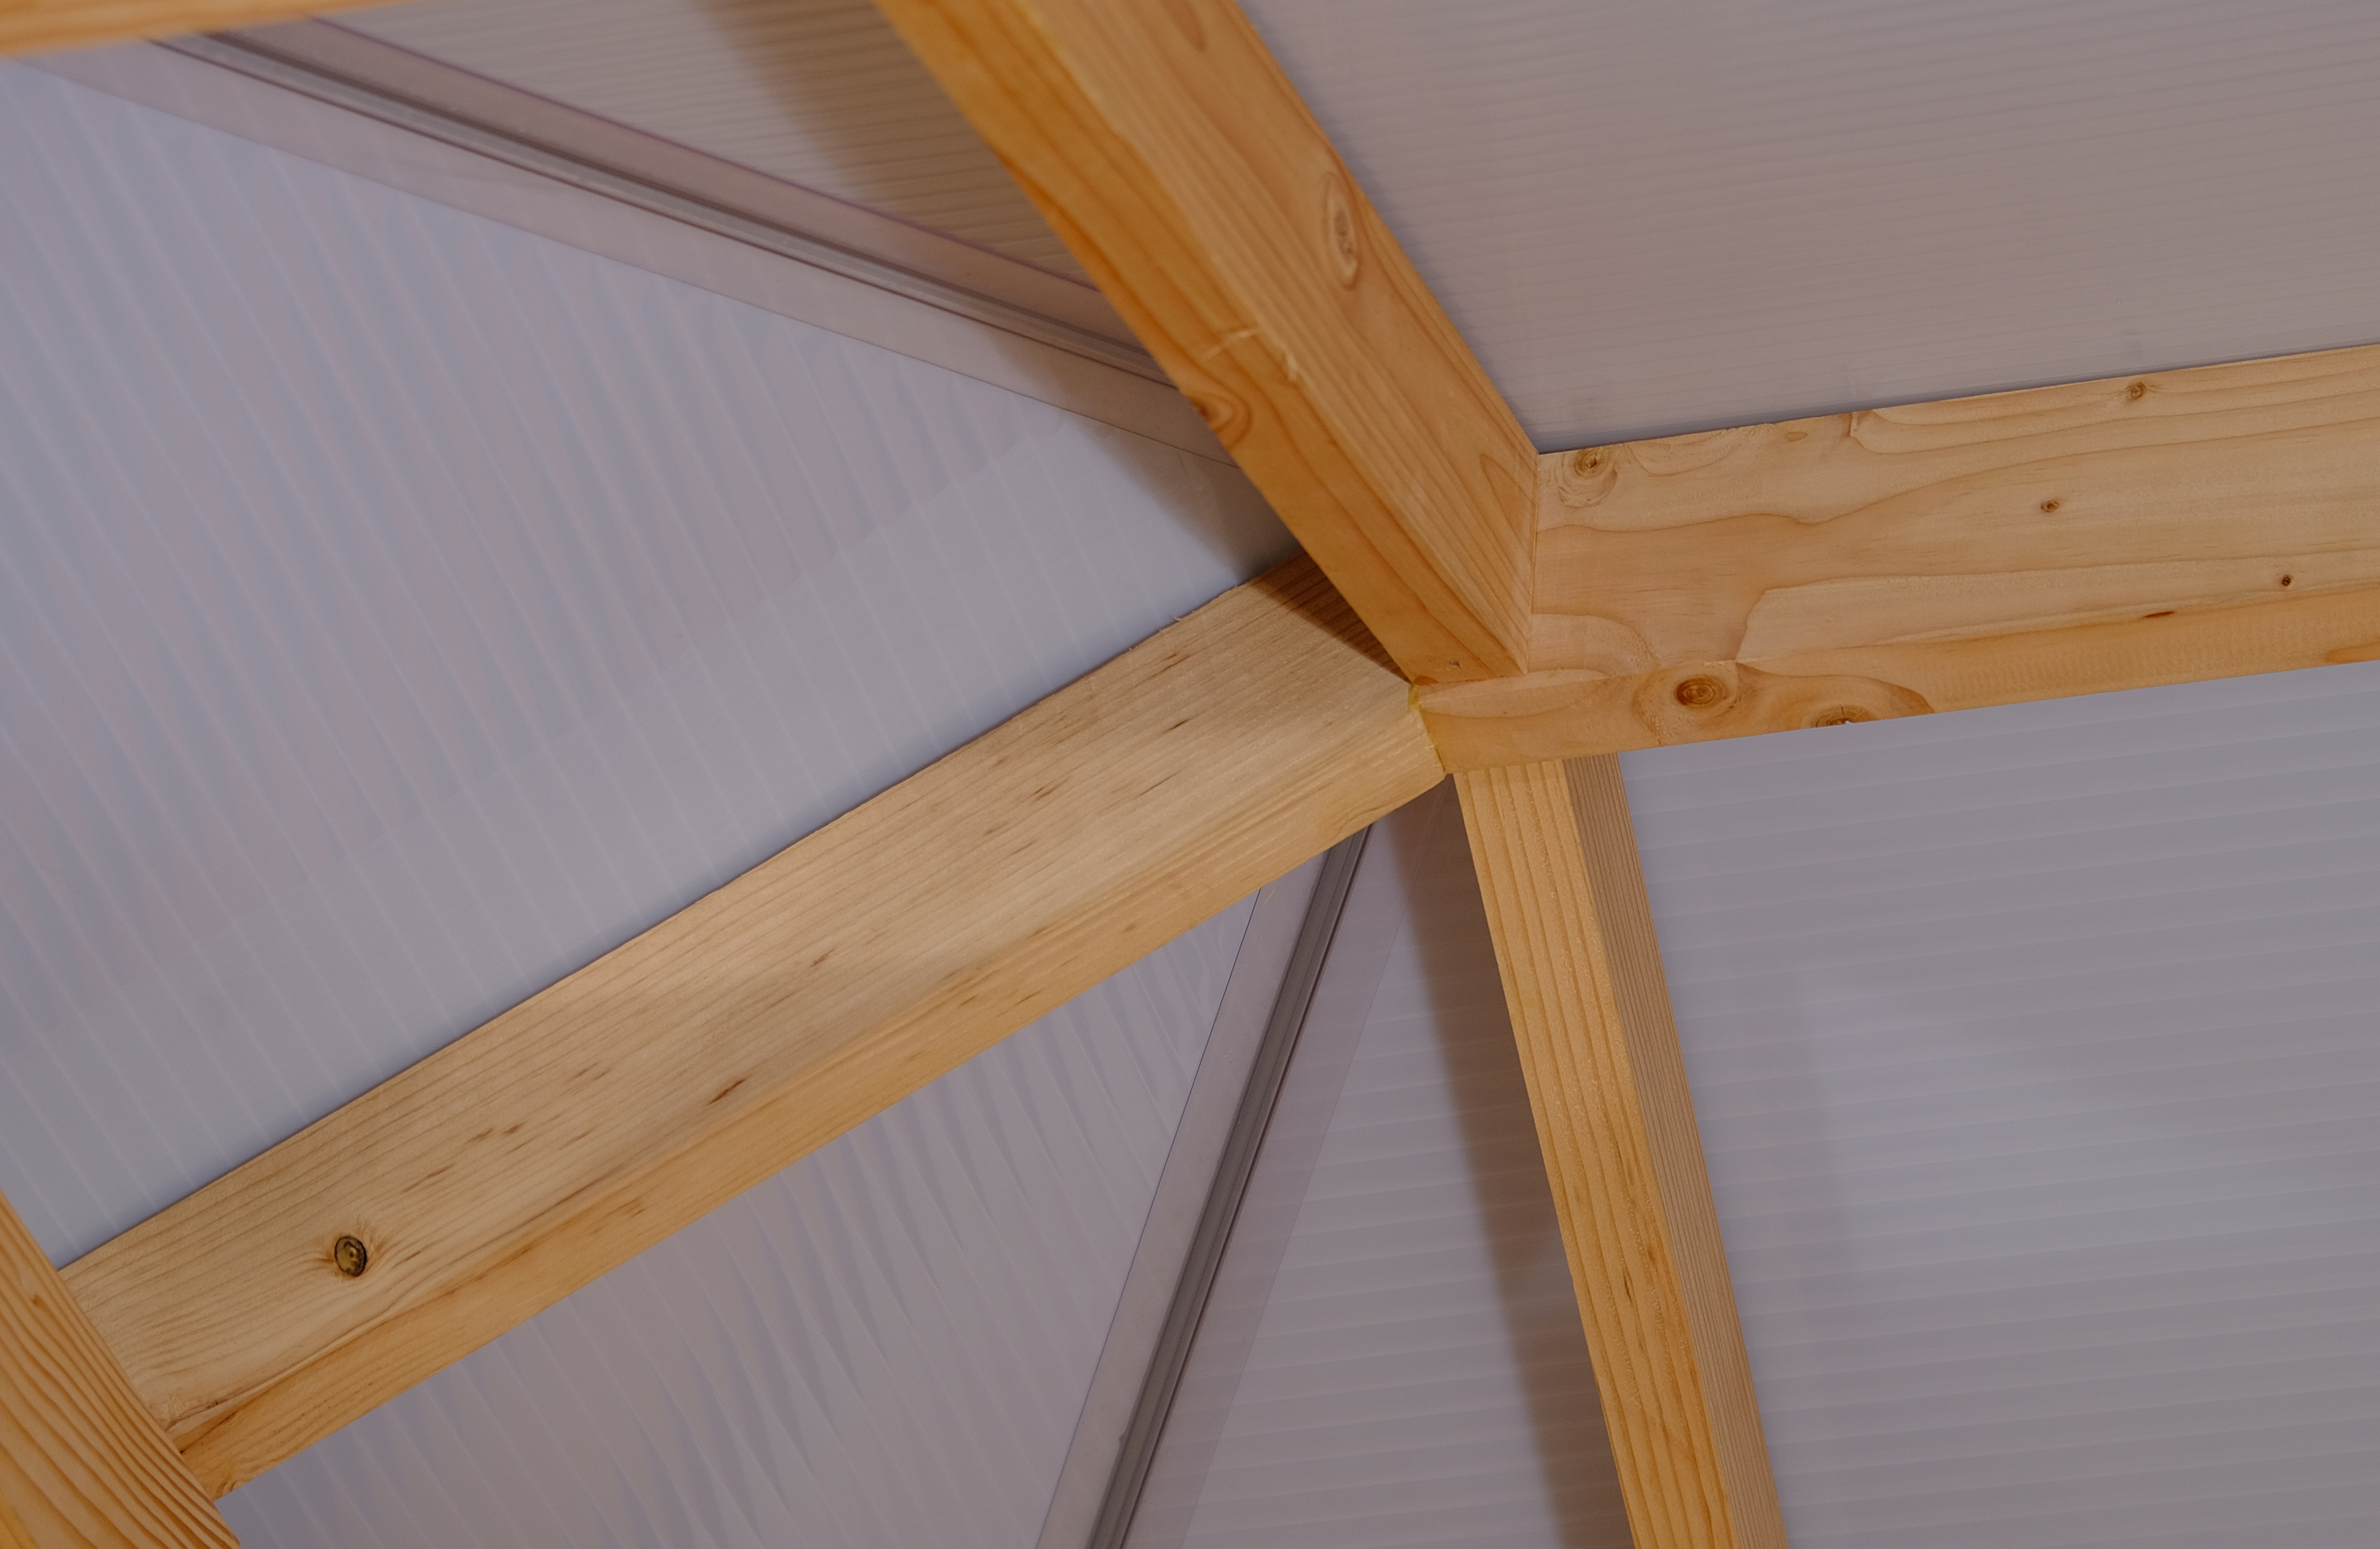
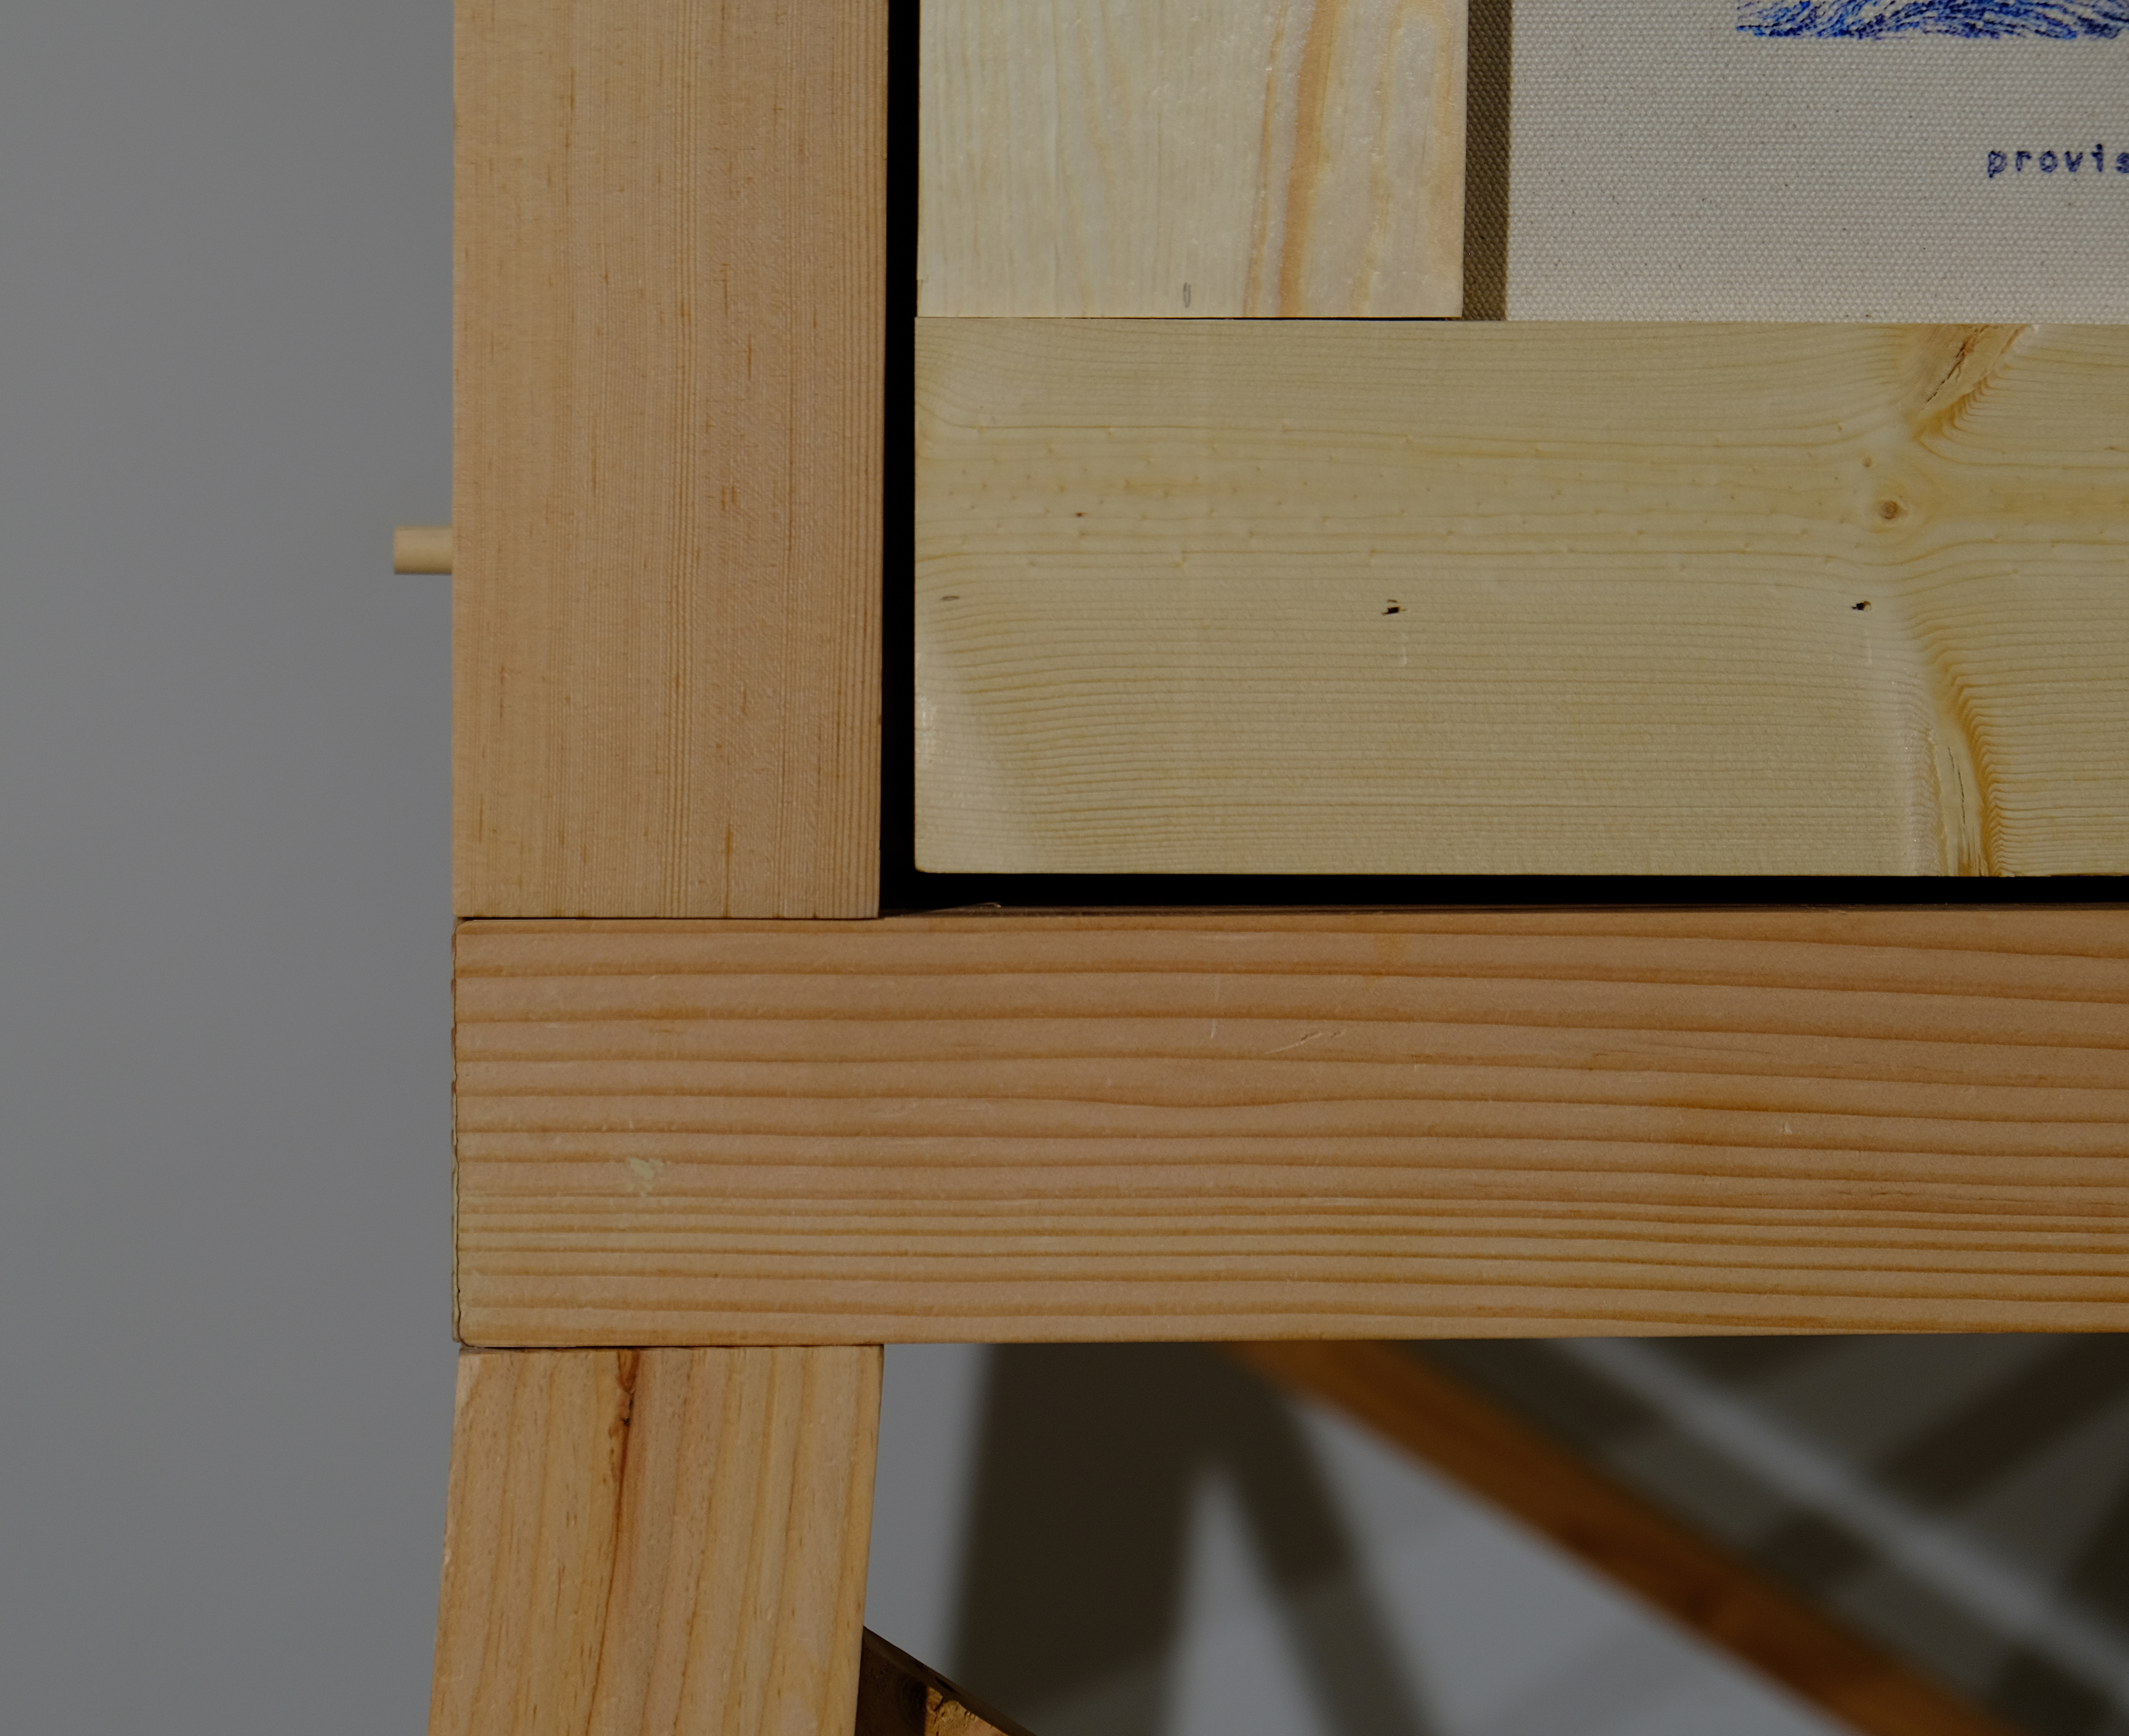
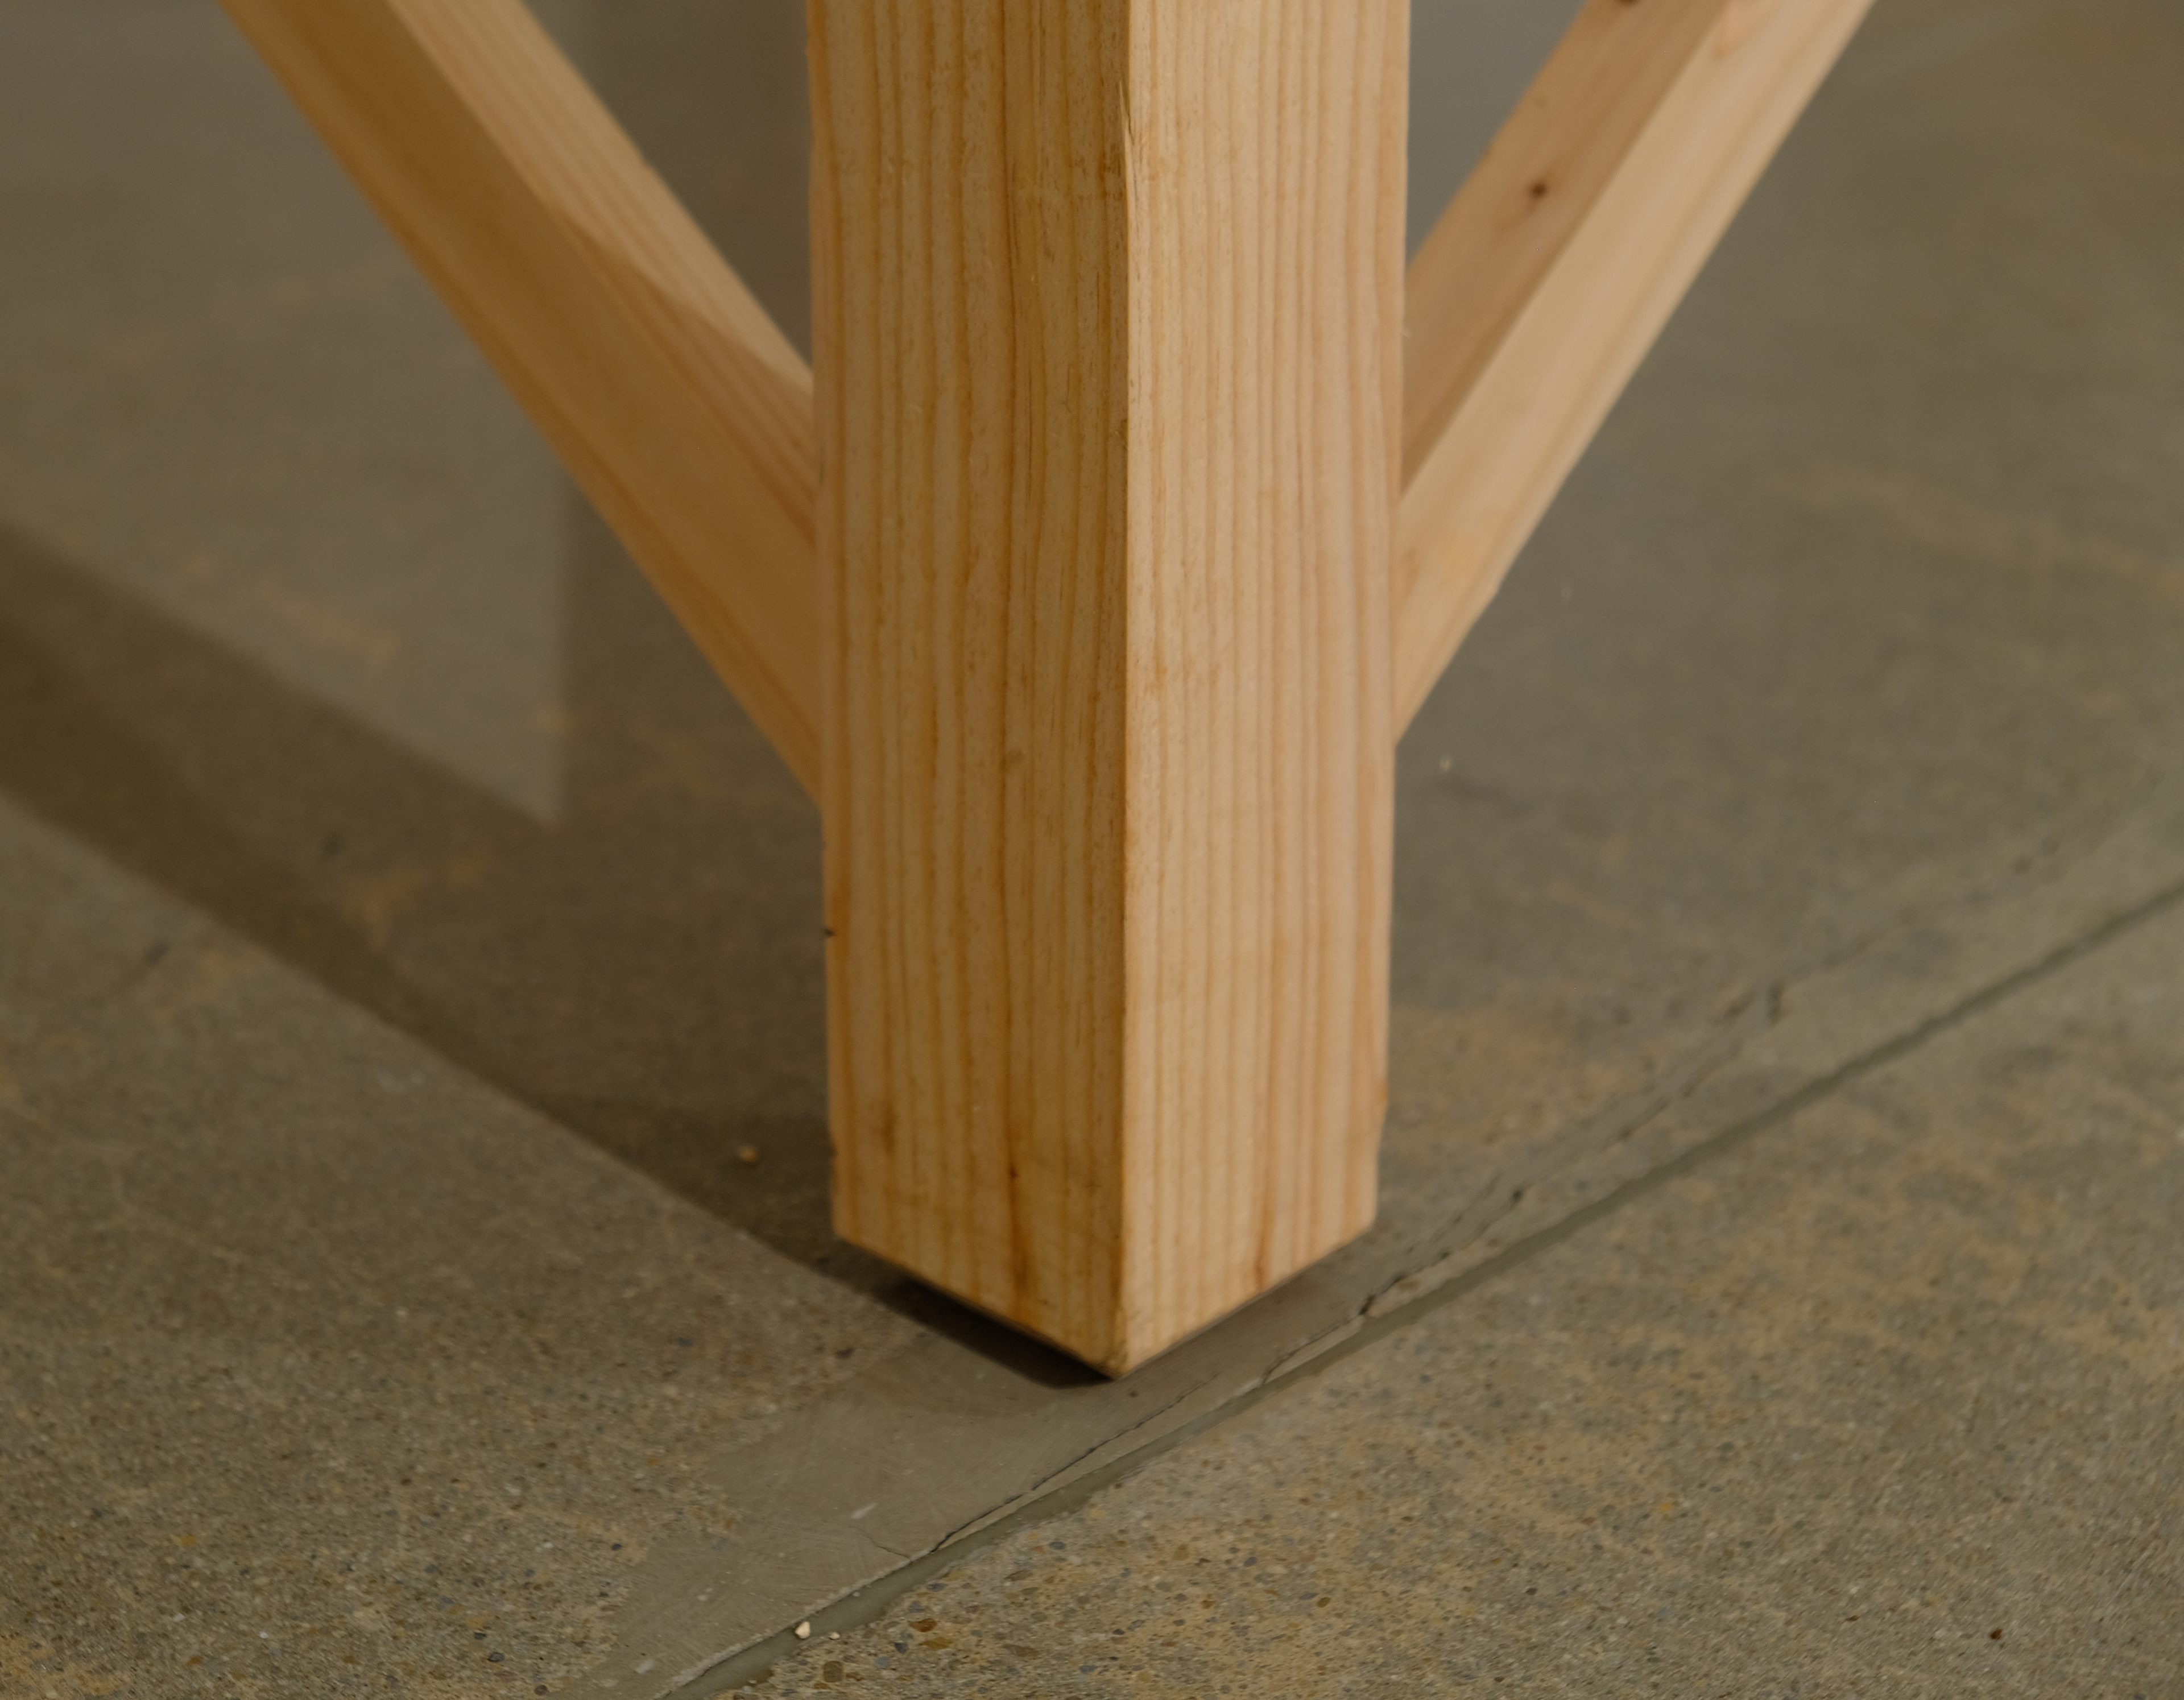
The Atmos 44 Weather Station, a small wooden structure (approximately 4 x 4 x 9’), is outfitted with four discrete communication panels. The panels embrace a multi-sensory approach to science communication and collectively serve as a community information hub to share the complex, layered narratives of weather, climate, data, and wildfire.
Each of the four panels, one per wall, takes a unique approach to science communication.
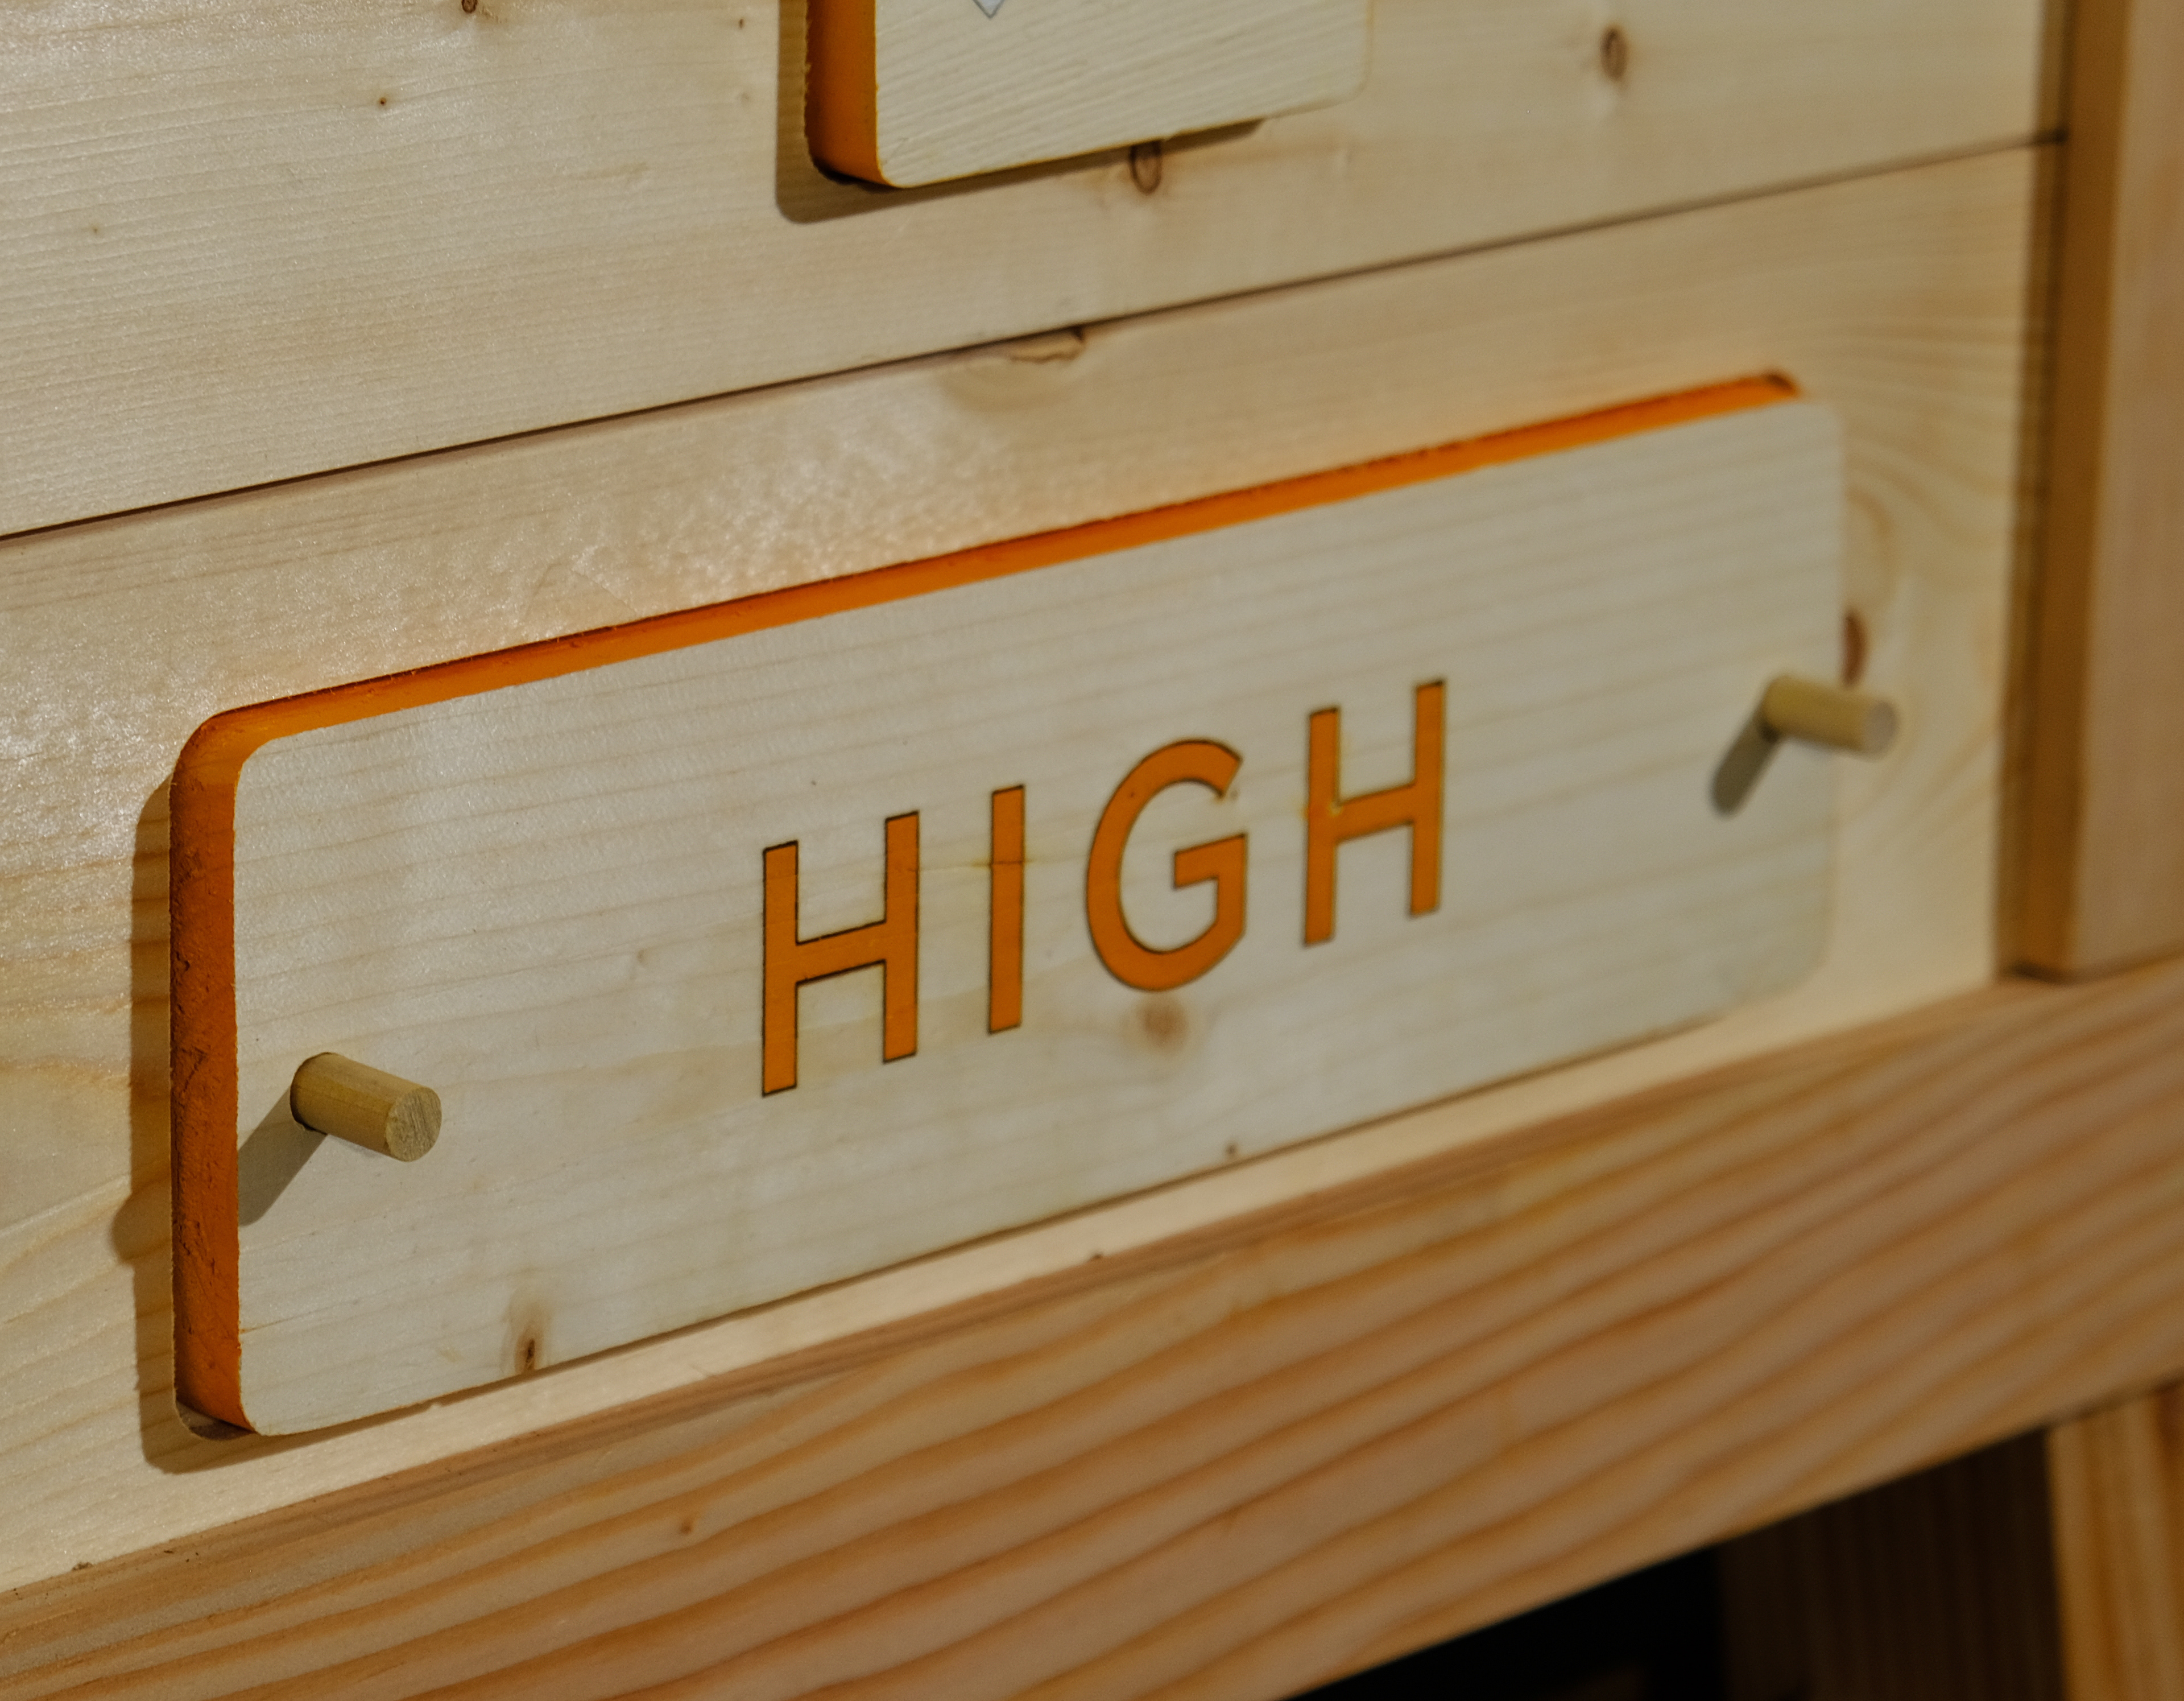
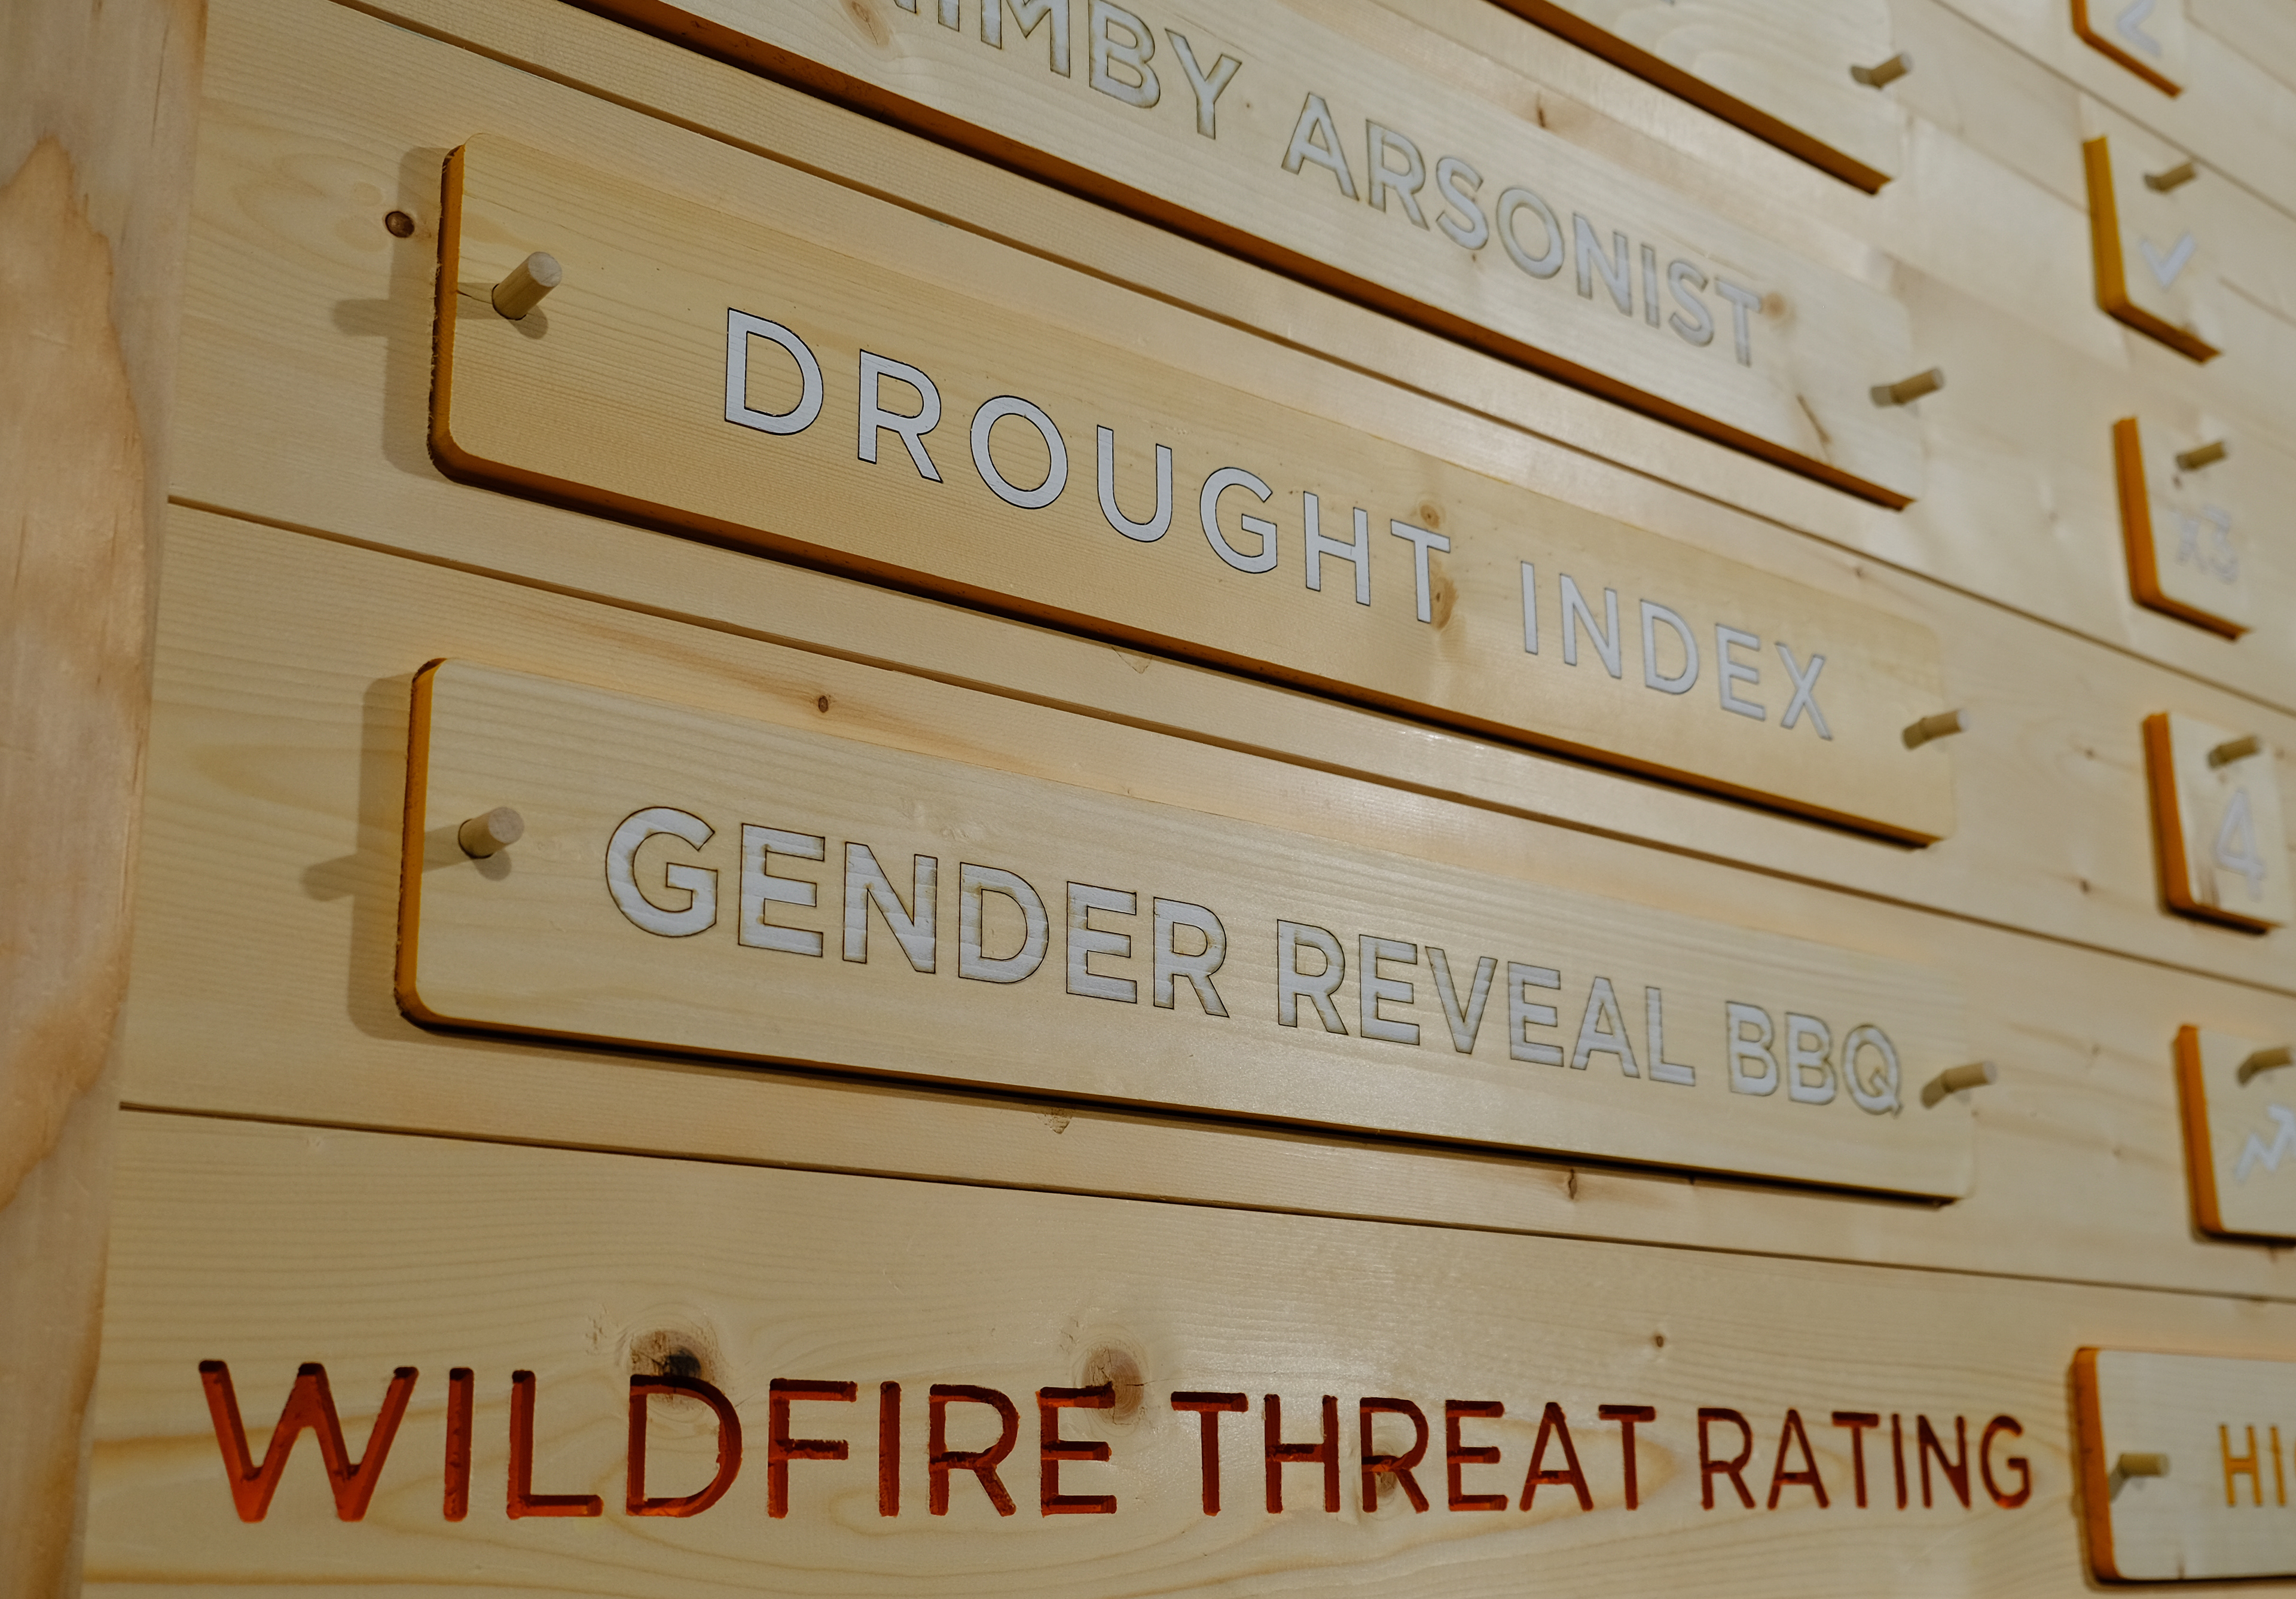
The Fire Weather Index is an interpretive panel that helps people quickly understand the potential risk of wildfire. This interactive panel features wildfire factor placards such as wind, relative humidity, fuel load, plus cultural inputs that influence wildfires, such as pyropinion and the presence of drunk smokers. Through a tally system, users can report the wildfire index as low, medium, high, extreme, or just F’d.

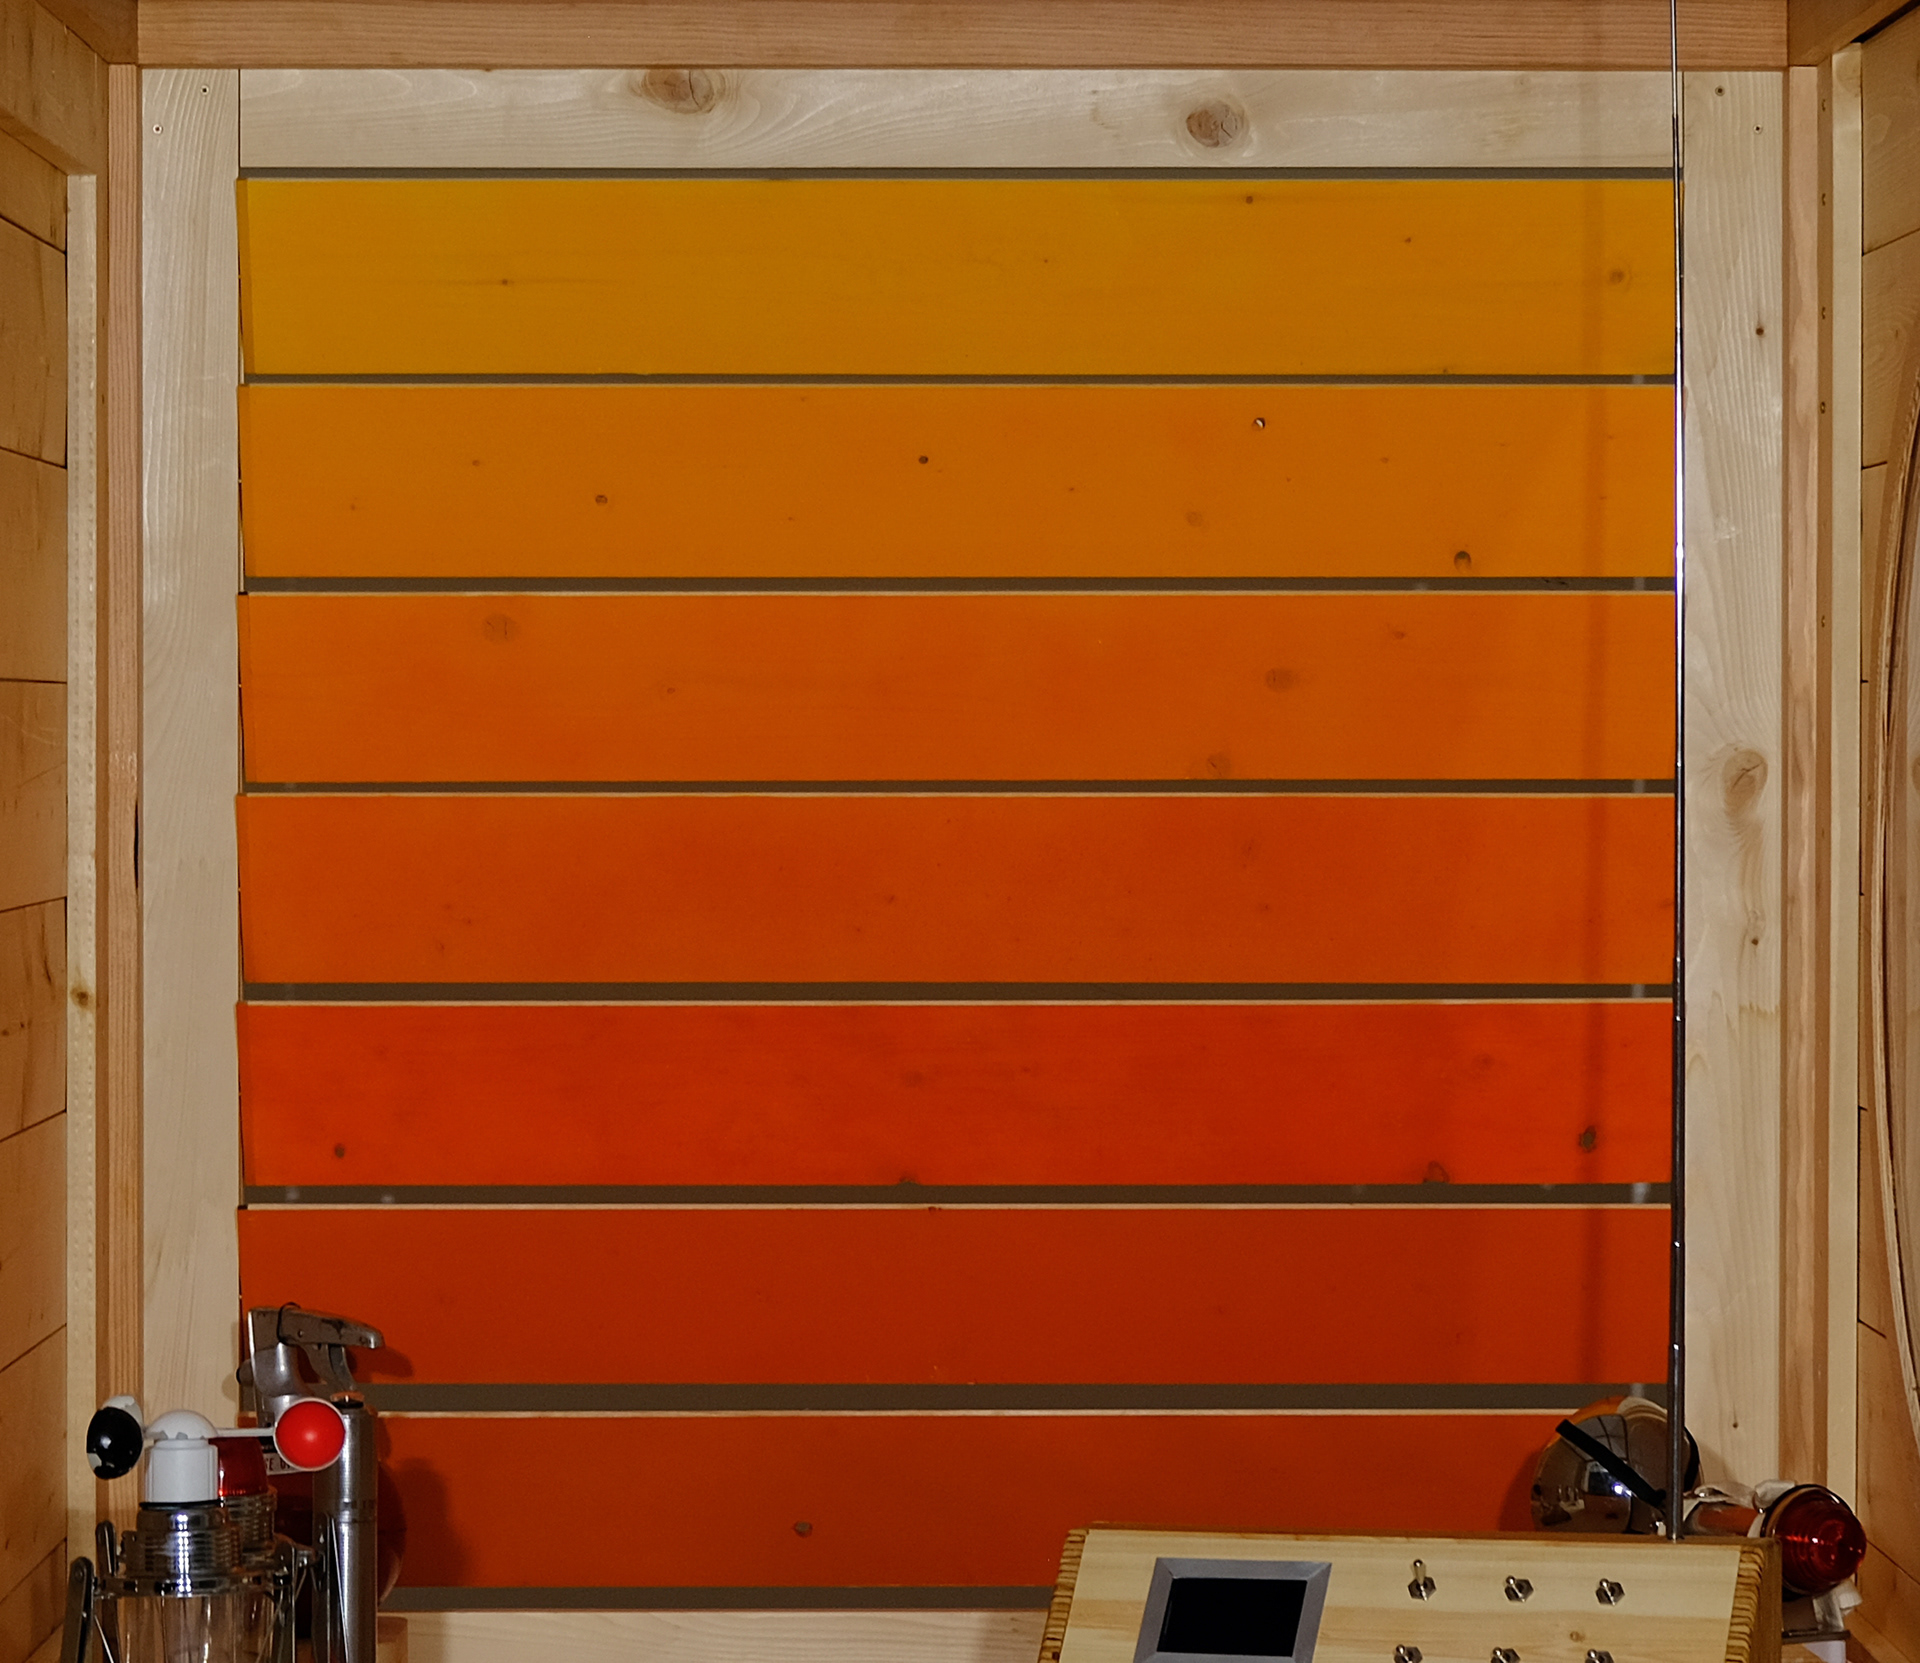
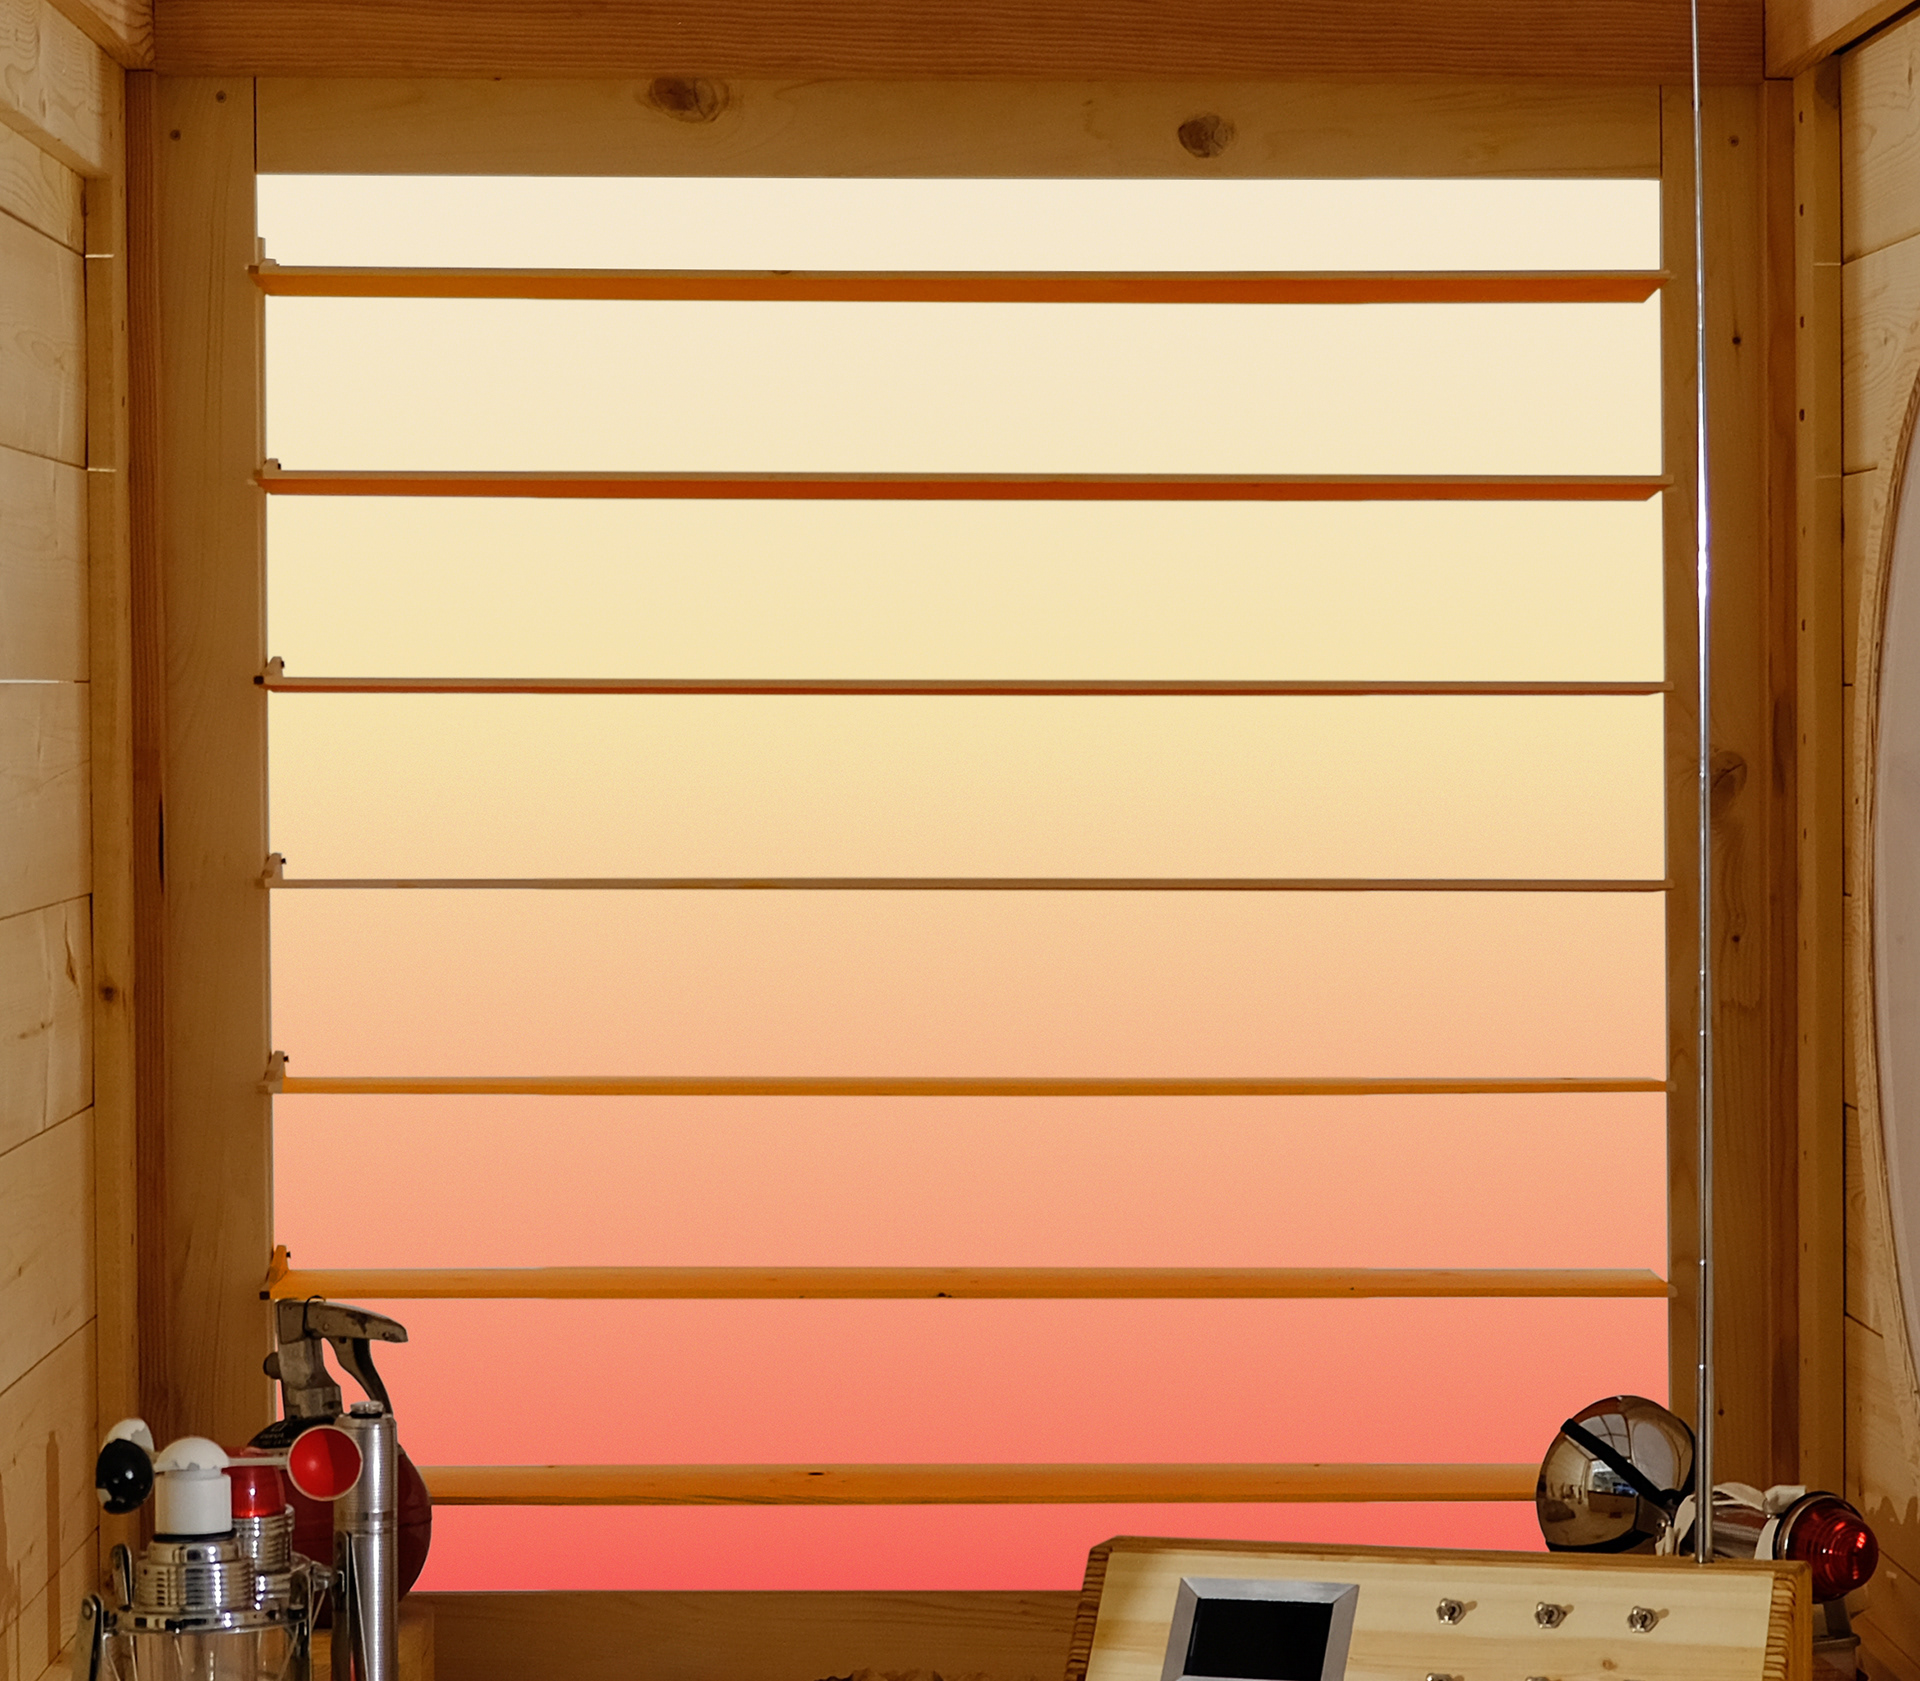
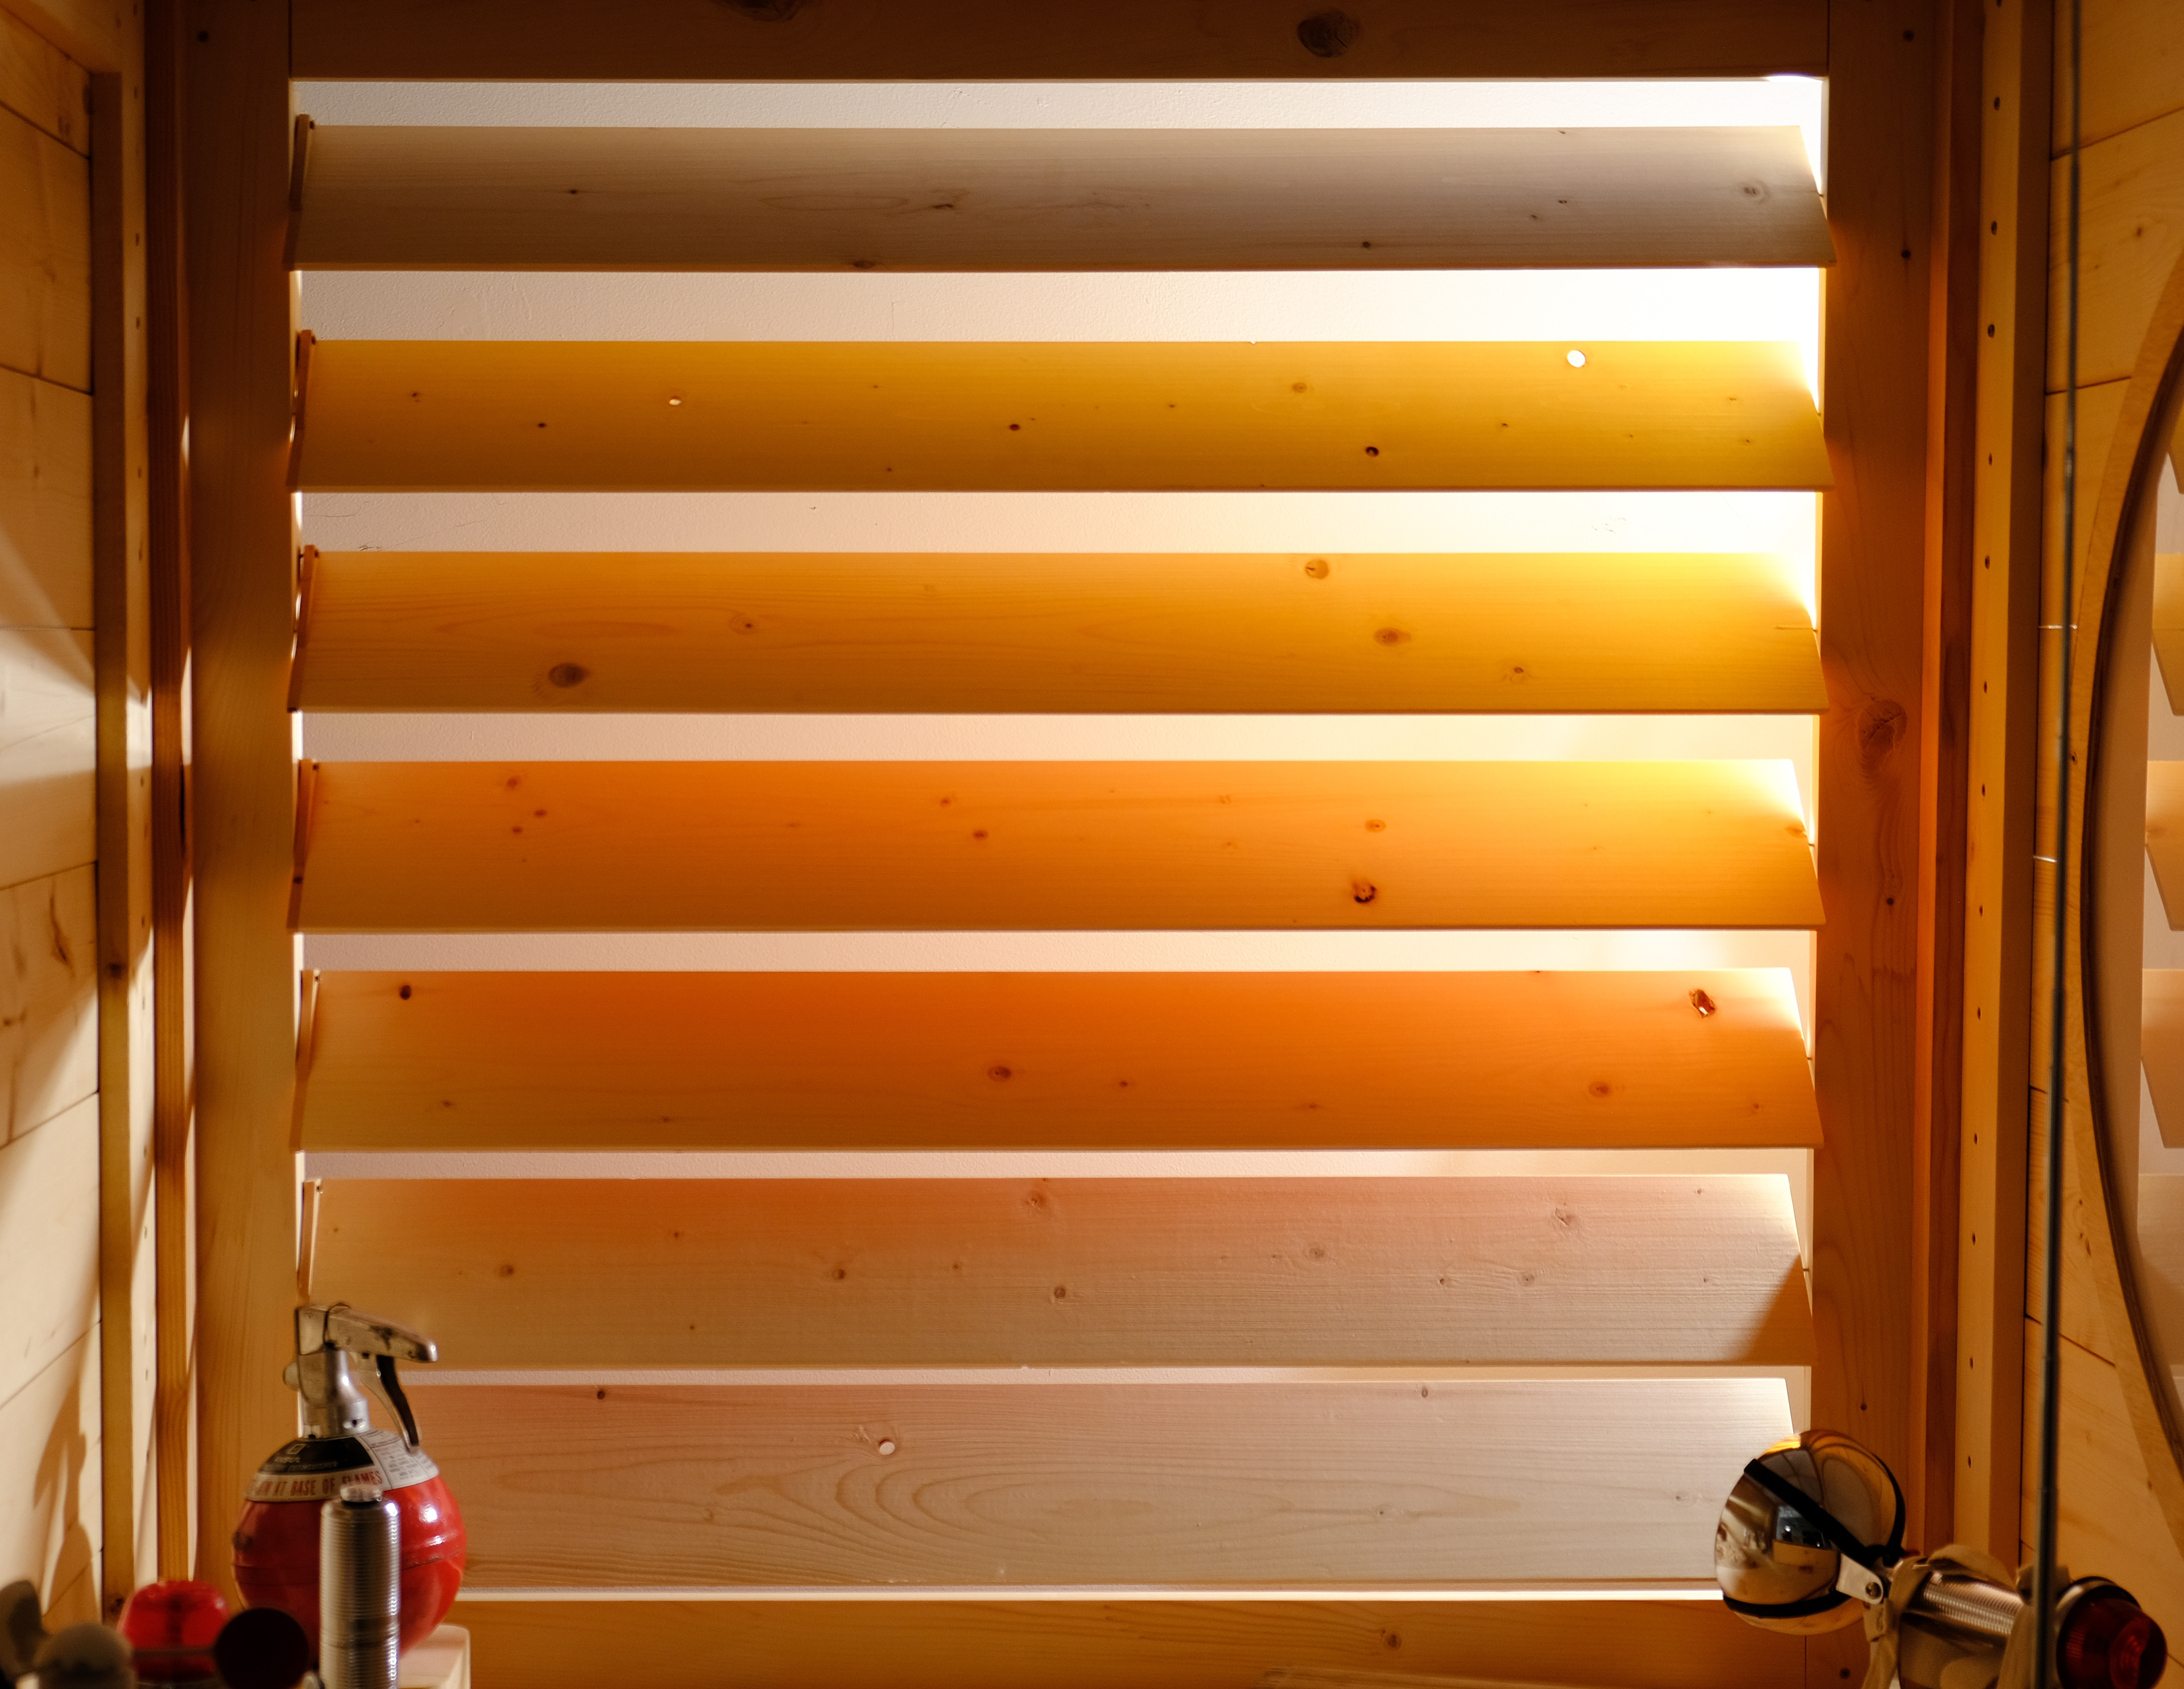
The Louver Thermoscreen is an adjustable component that can be calibrated to accommodate seasonal changes to achieve optimal airflow within the weather station. The louvers protect the sensitive instrumentation on the inside from high winds, heavy rains, and harsh radiation. Even when the vents are closed, air is able to circulate and ensure accurate weather instrument readings. This thermoscreen has absorbed a significant amount of excess heat, and bounces warm ambient lightwaves to make a comfortable workstation.
The Community Boom Box is a loudspeaker that broadcastswildfire weather information such as fuel loads, drought conditions, high wind events, lightning storm forecasts, gender reveal party invitations, and other critical wildfire factors. Currently, the panel is connected to the Synesthesia Synthesizer, which plays sonifications of PNW forest data collected by HJ Andrews Experimental Forest’s scientists during the Holiday Farm Fire. These sounds can combine with interpretive narratives delivered by Casey Keenan and the NOAA weather robot guy, describing the interactive environmental conditions that led to the high-intensity burn.
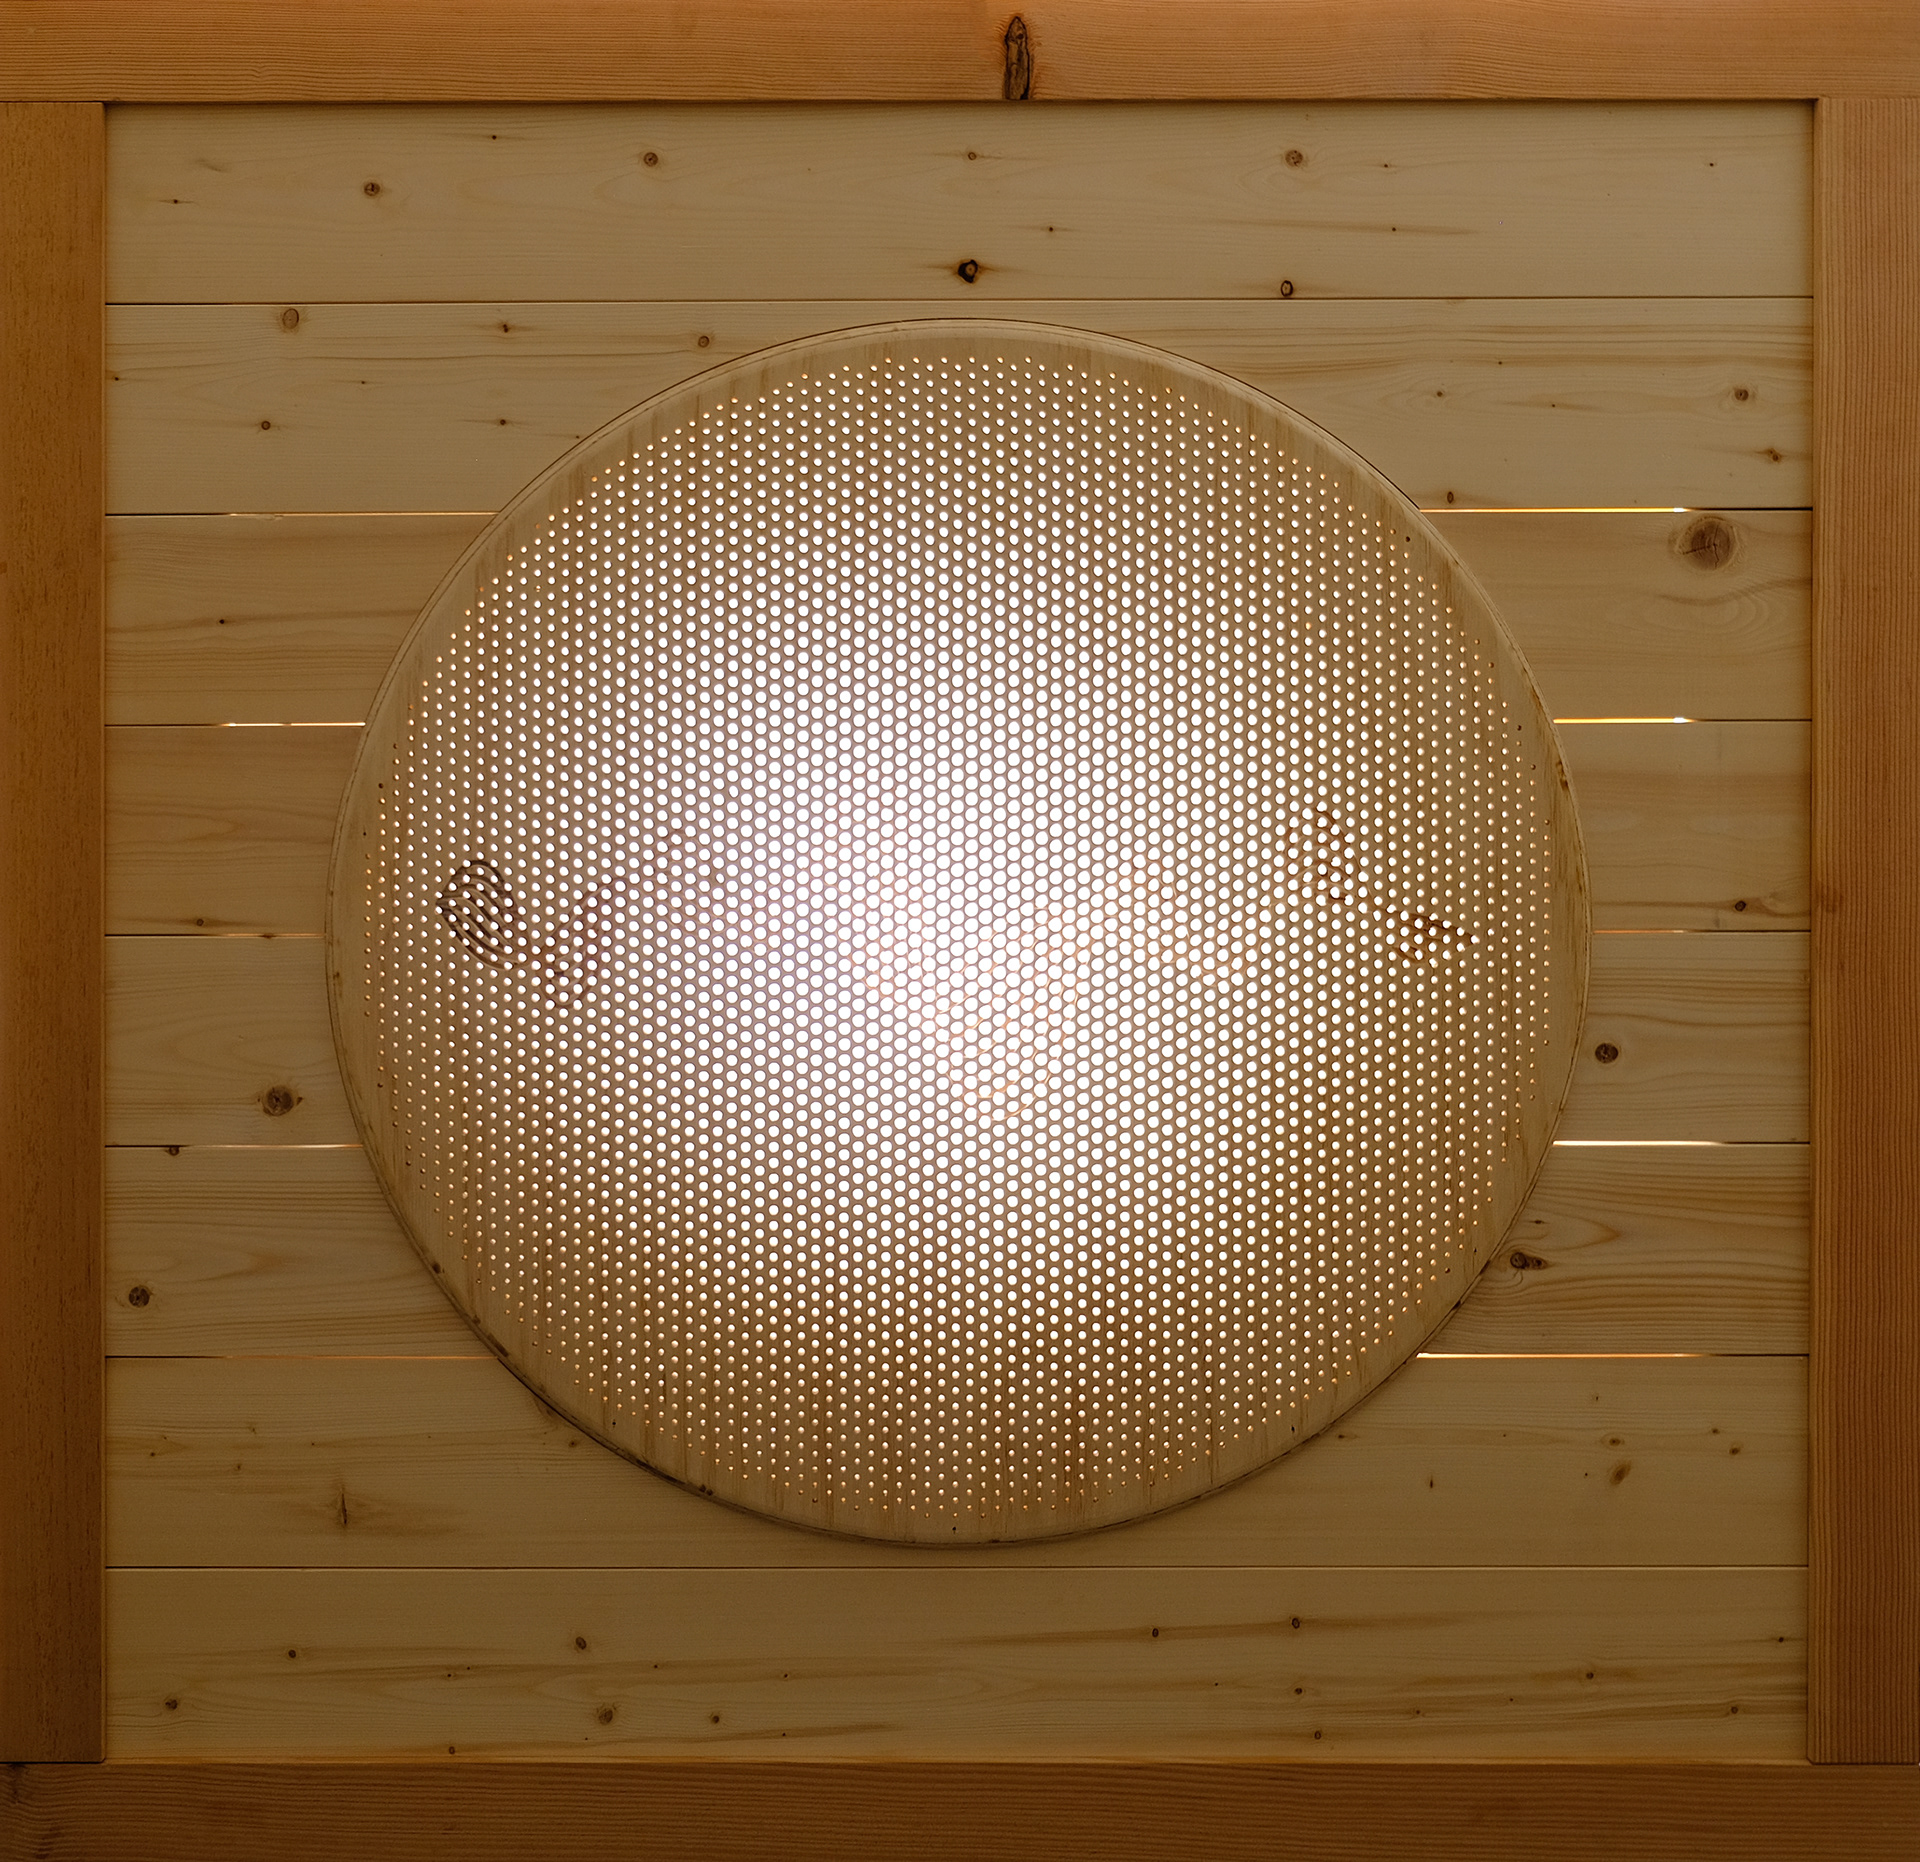
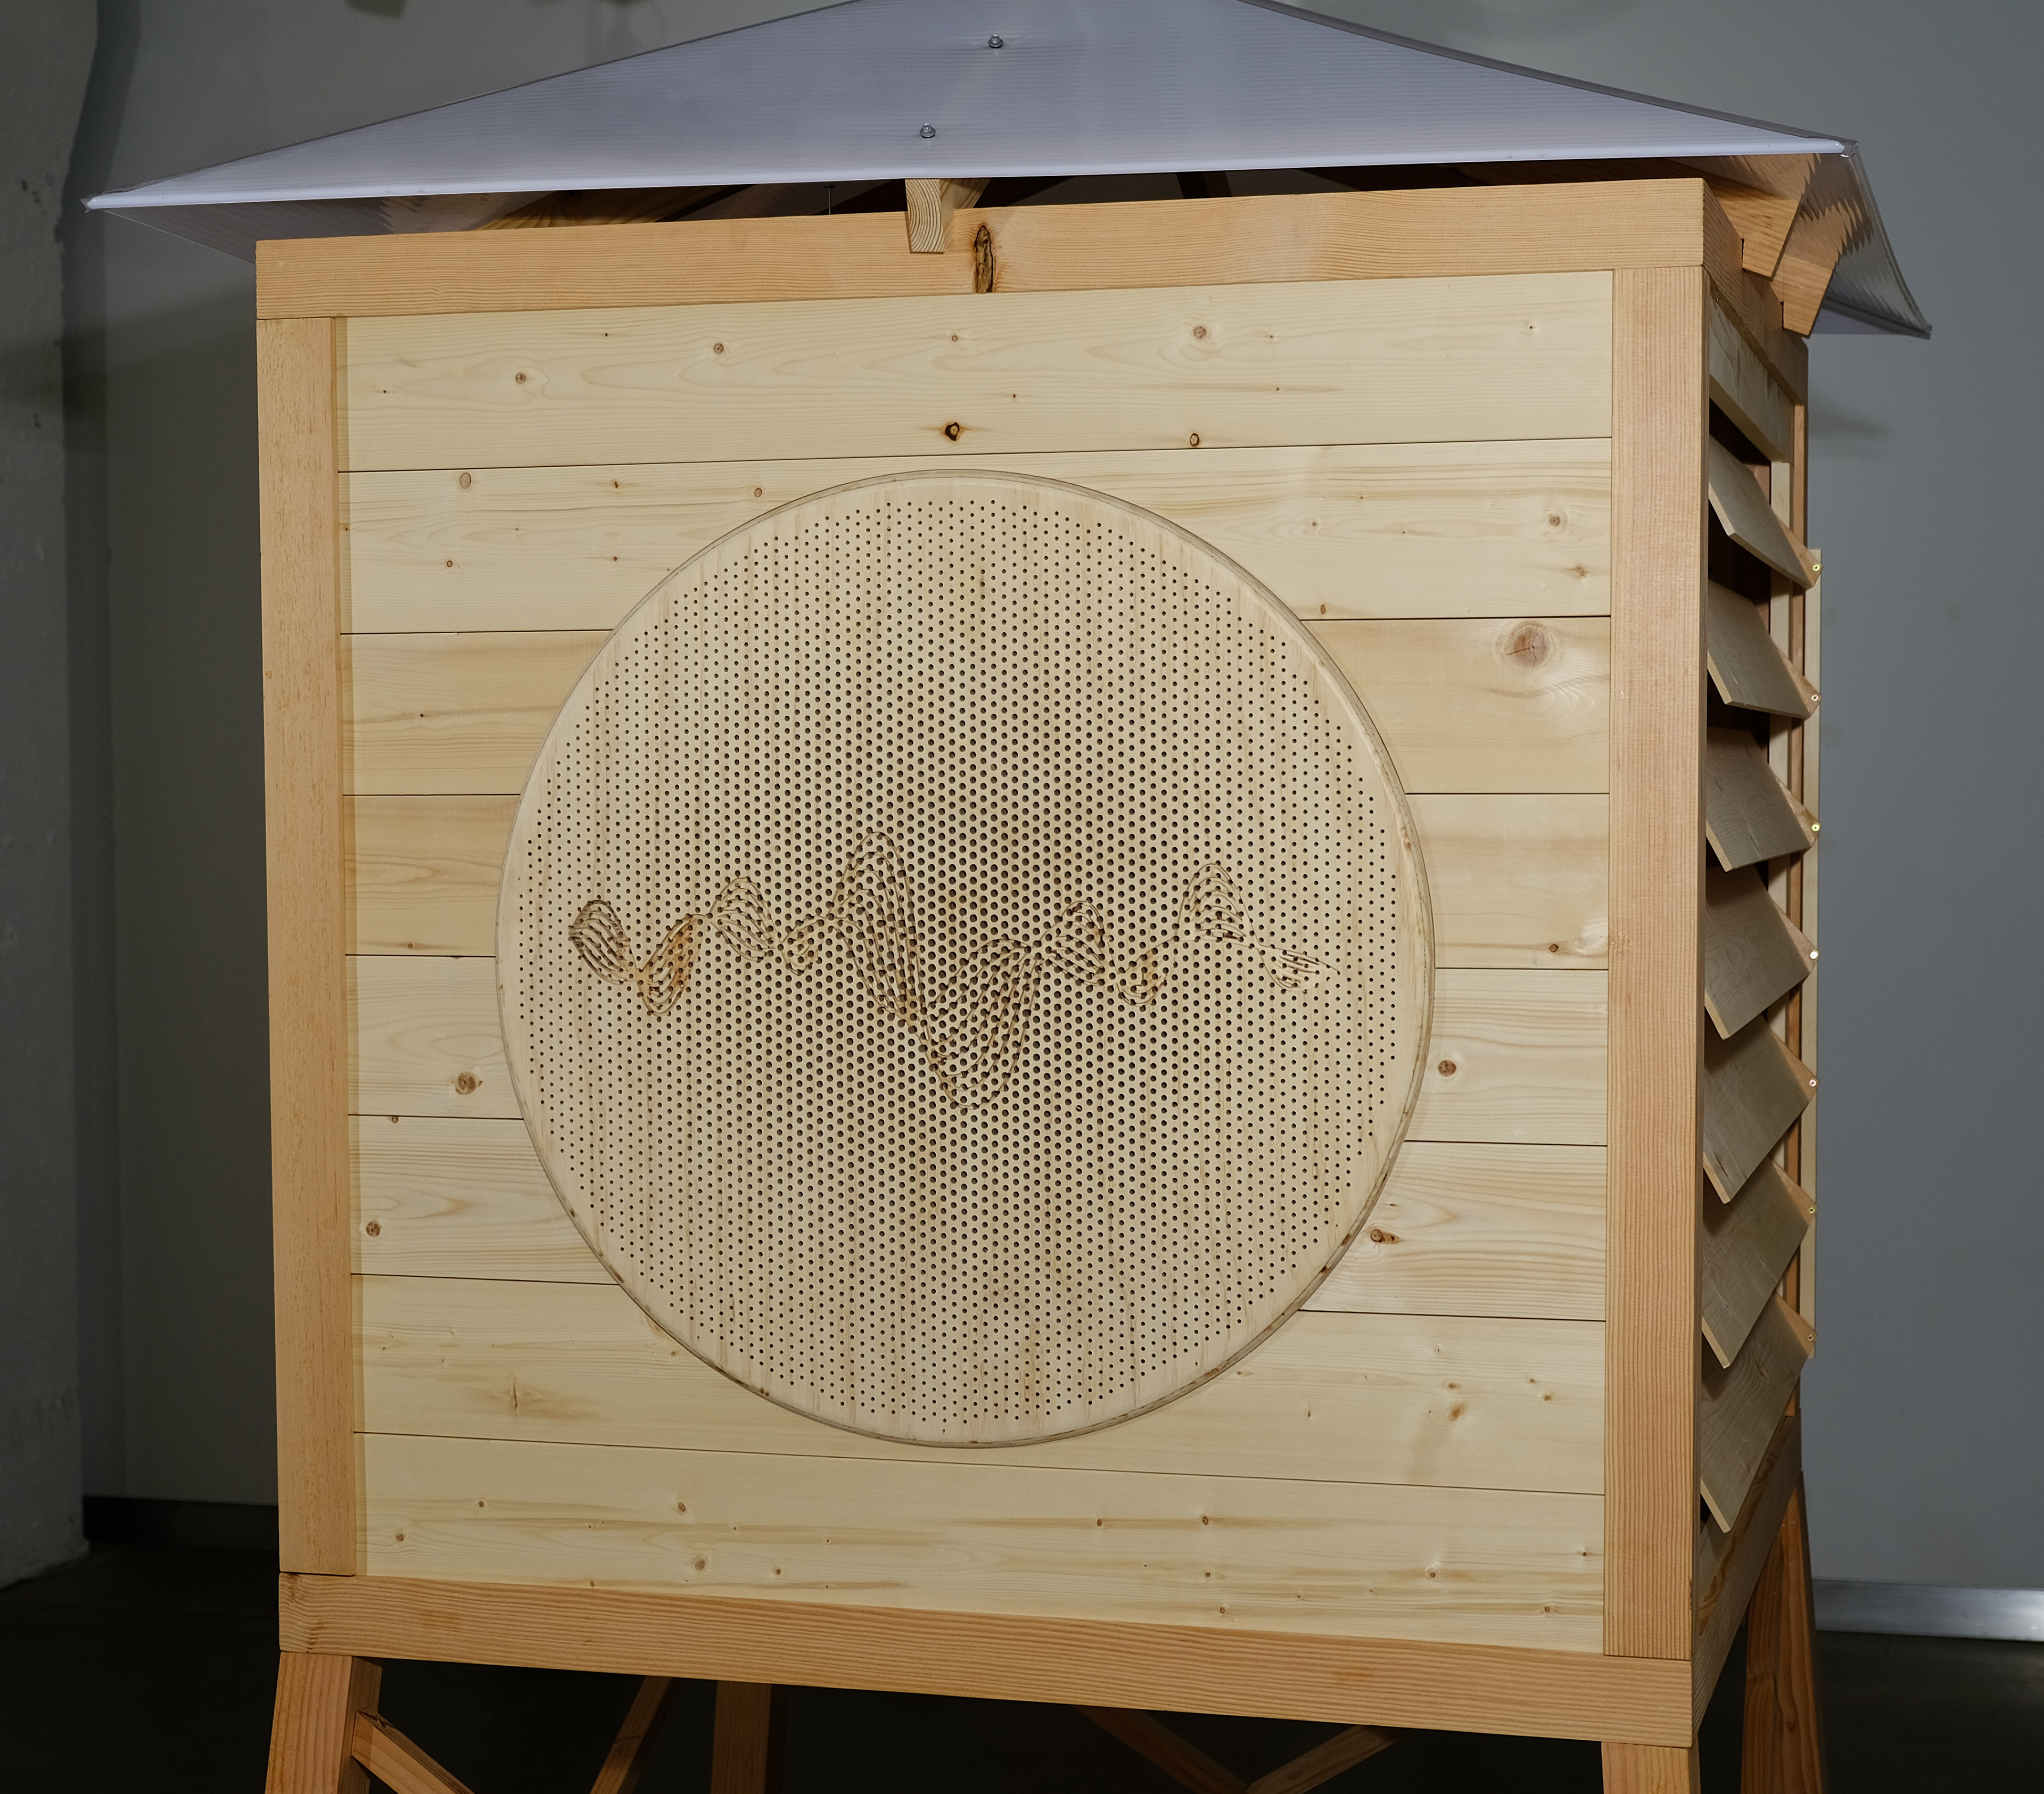
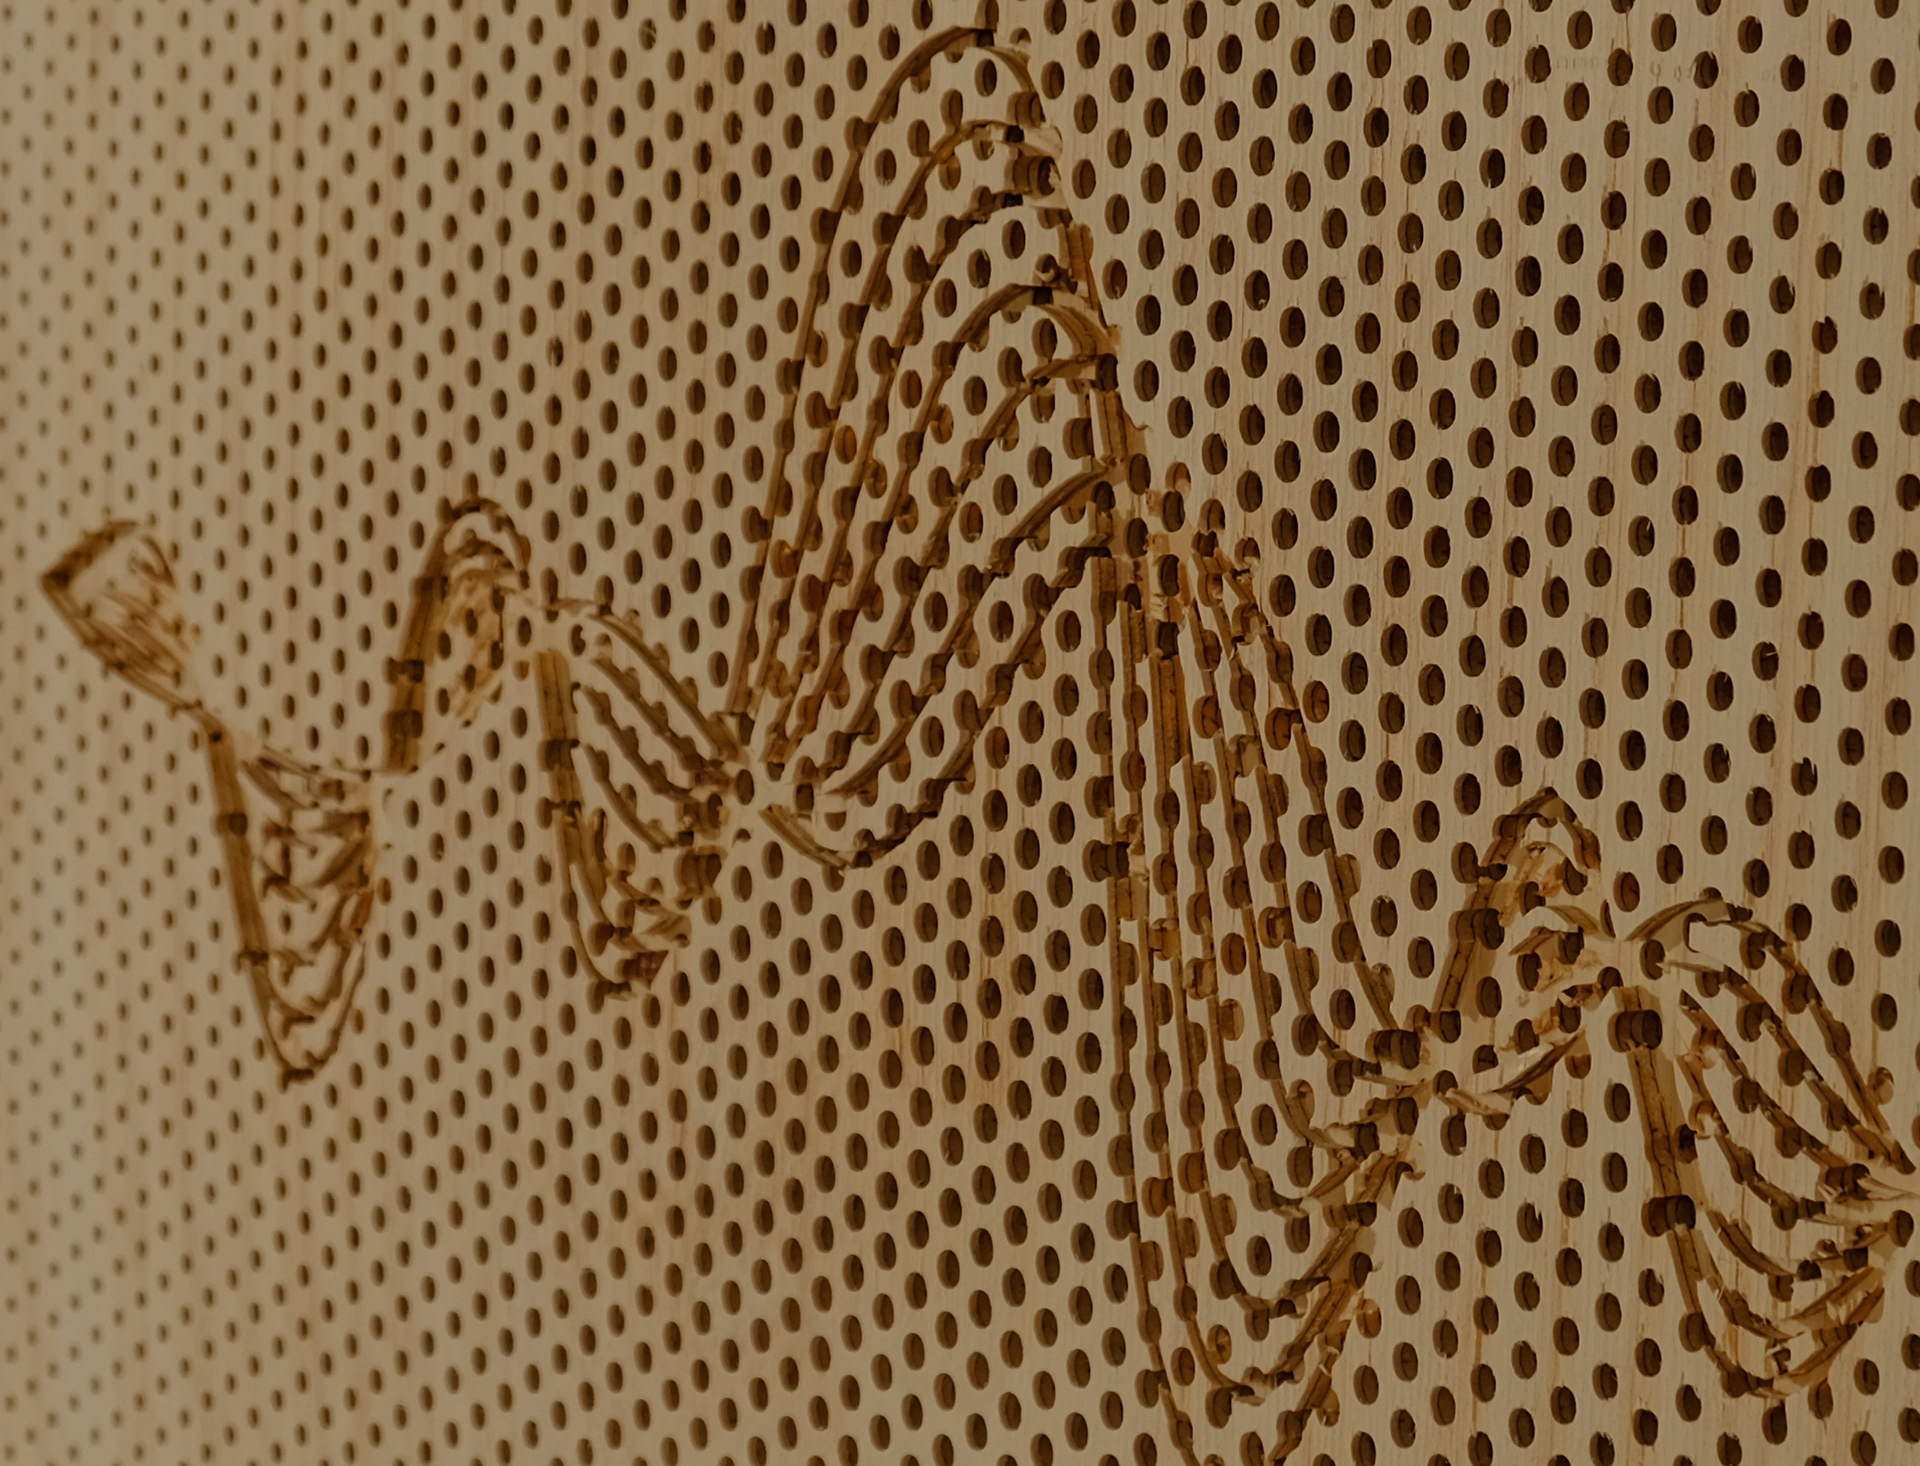
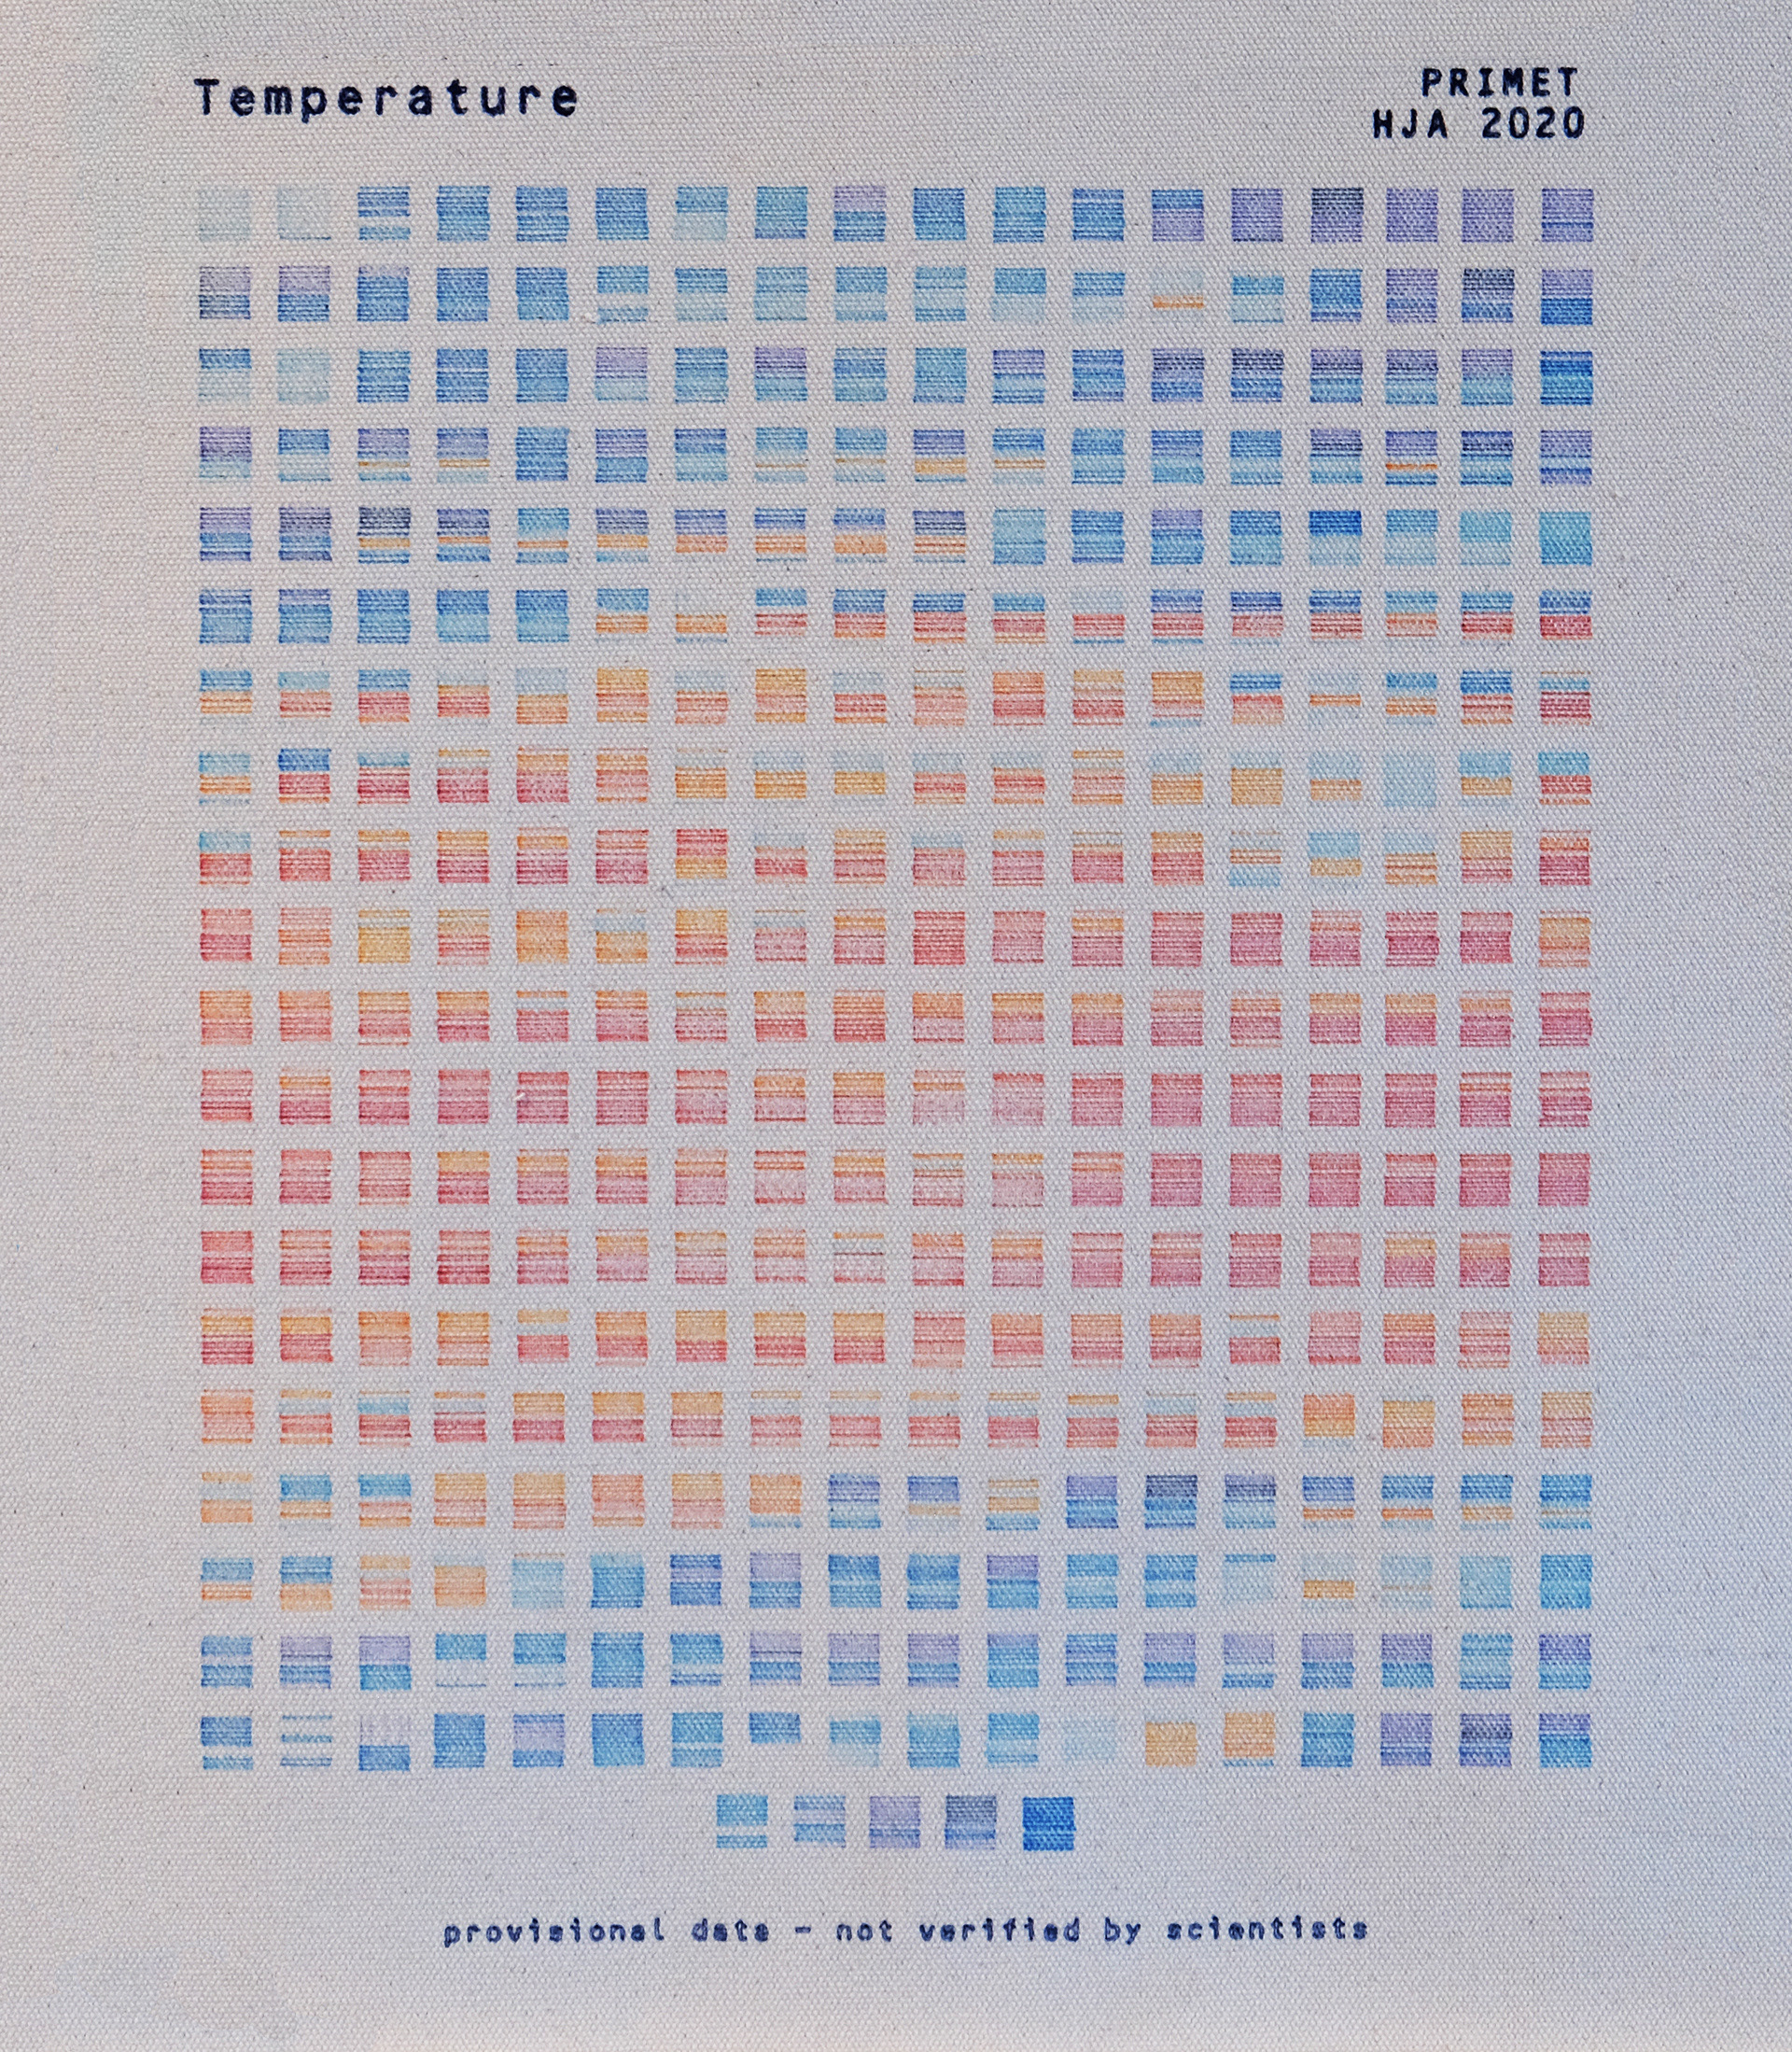
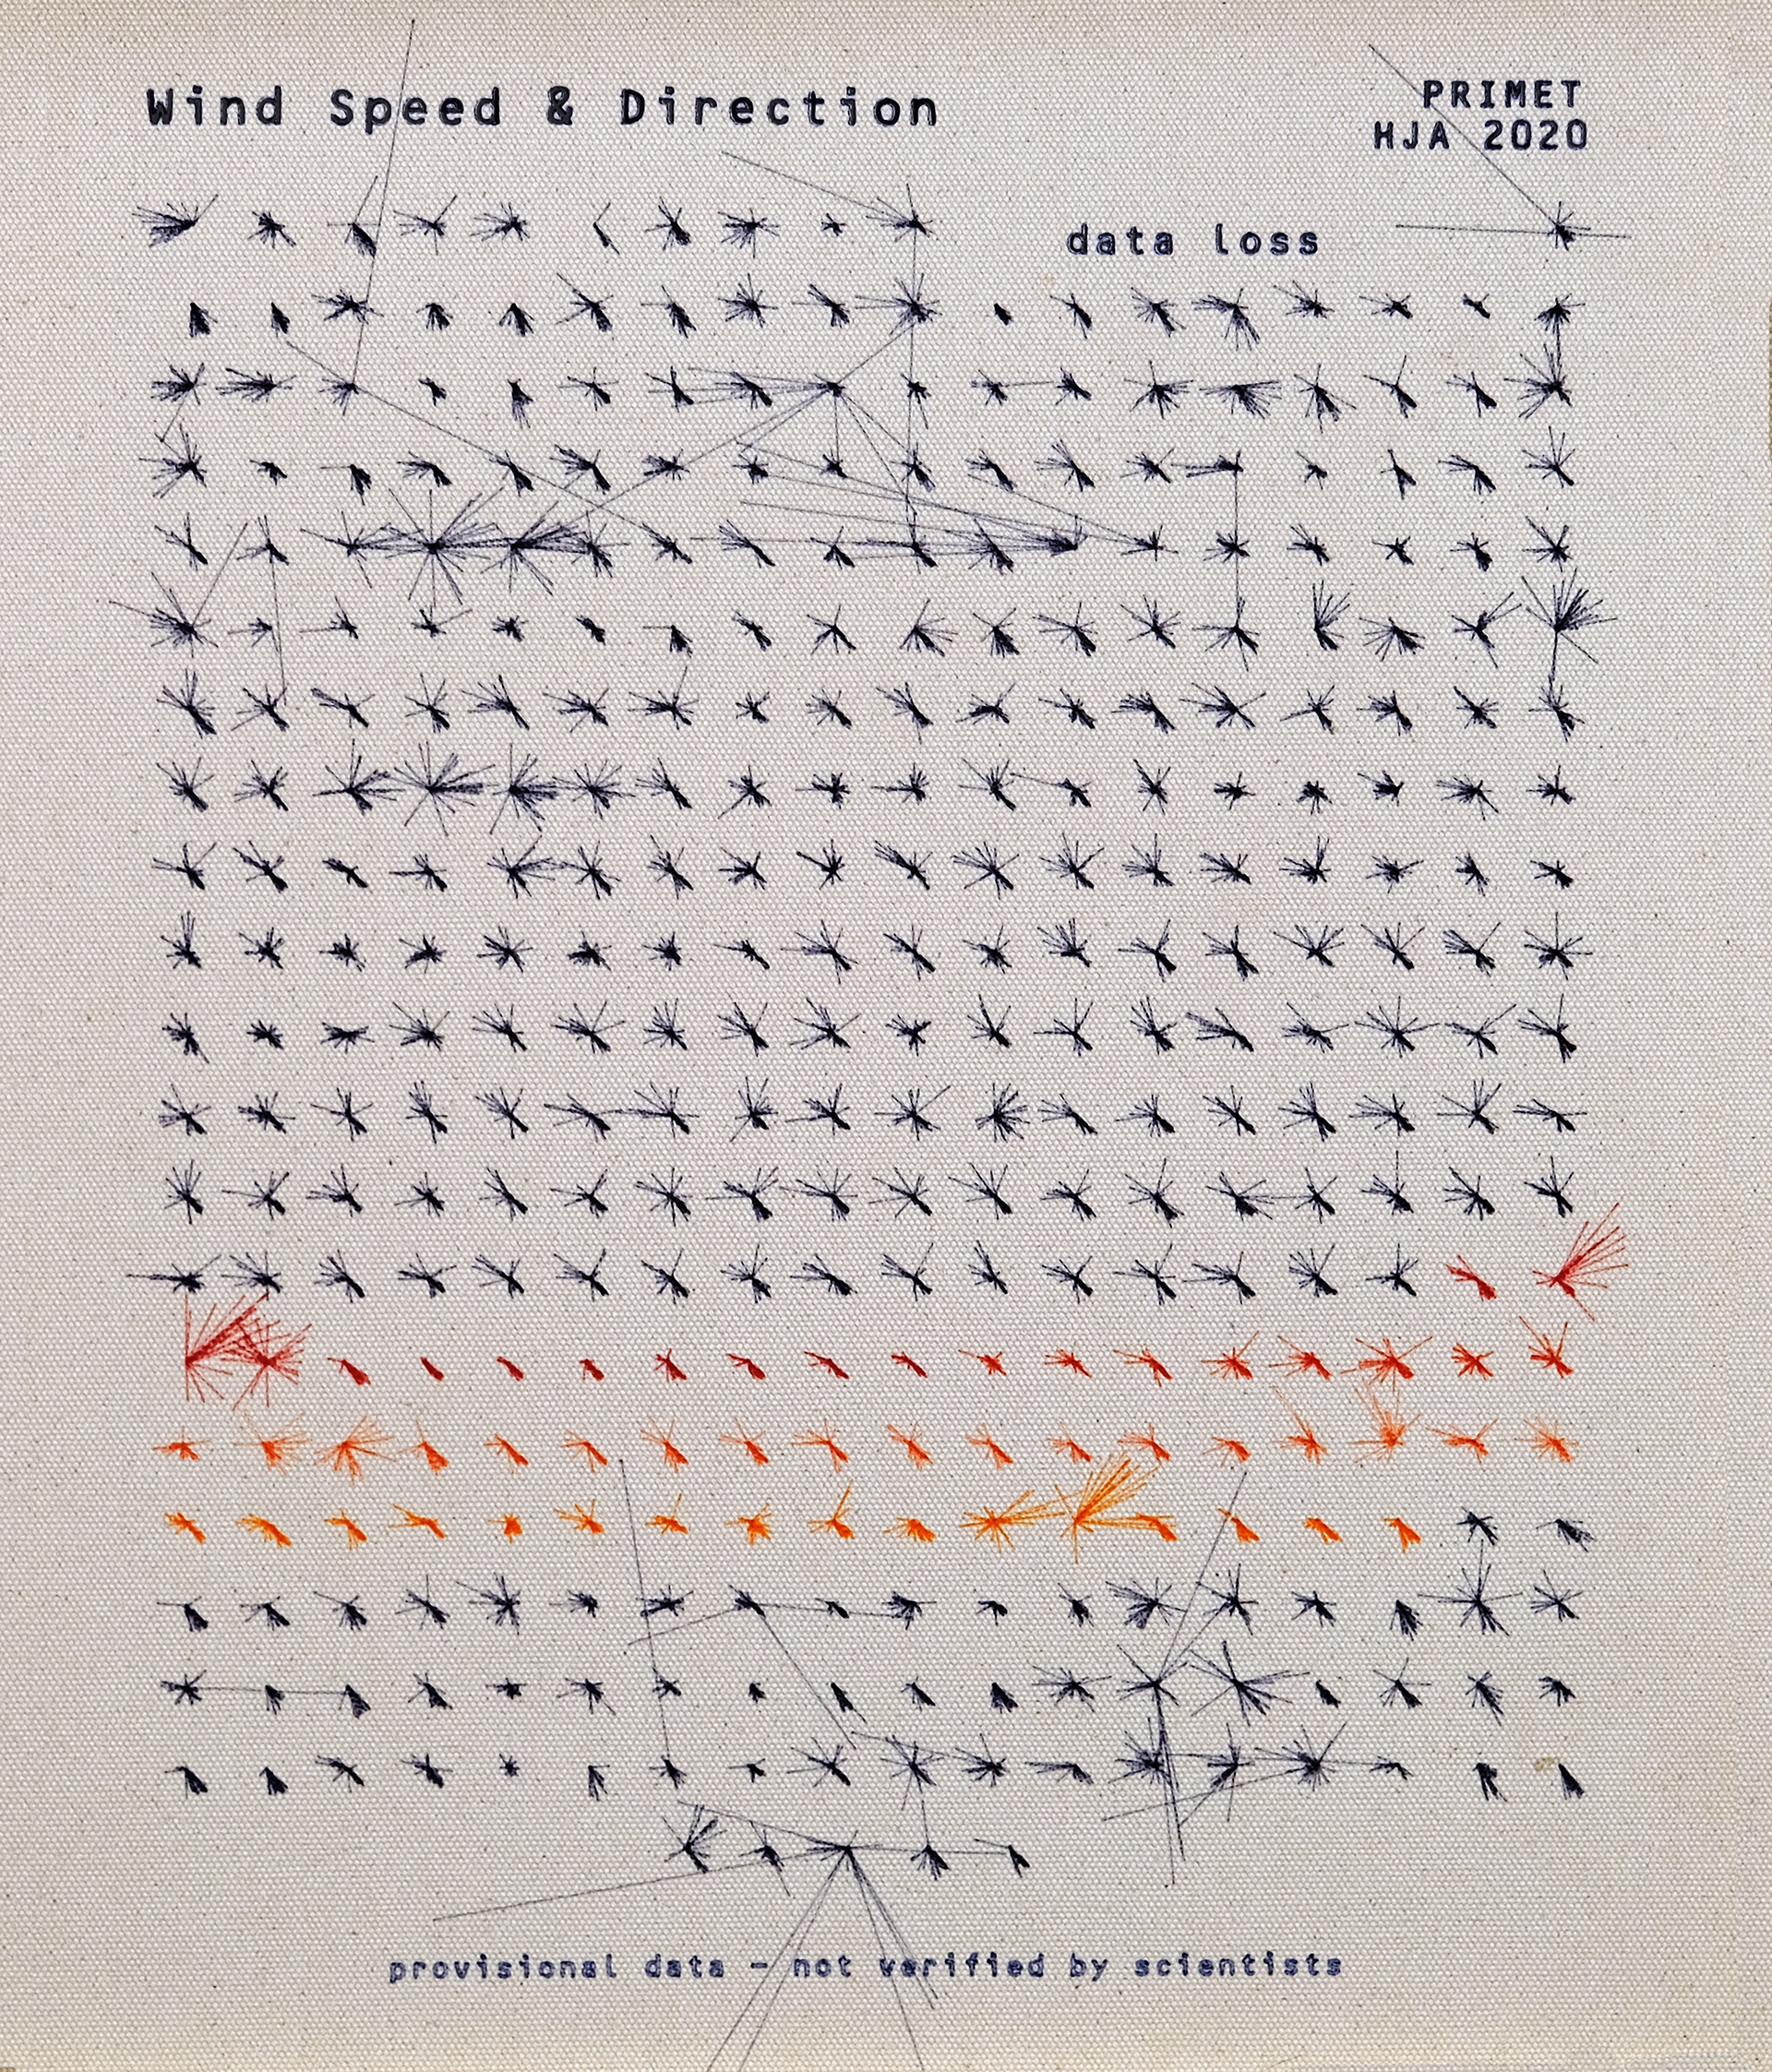
The Weather Cycles Display features PNW forest data visualization to highlight the rhythmic nature of these ecological processes. Temperature, wind, and stream flow are all tracked on the exterior “barn” doors.
Through these visualizations, oscillations of cyclical processes are revealed that our weather patterns create.
The water and streams have their own time, the vegetation in the forest has its own time, and the wind and the air have their own time. We, as observers, have our own time, where we can observe these infinite and overlapping combinations of unique moments.

This project was done in collaboration with David Buckley Borden, Casey Keenan, Isaac Martinotti, Nancy Silvers, Fred Swanson, and Ian Vierck.
This was on display as part of the Ignition Installation through the Center for Art Research. Read more about that installation and the additional collaborators involved here.
William Bonner's work was supported by a Ford Family Foundation Grant through the Center for Art Research. Additional financial support for design and fabrication was provided through creative research grants to David Buckley Borden from the Fuller Center for Productive Landscapes at the University of Oregon and the OSU Foundation's Andrews Fund.