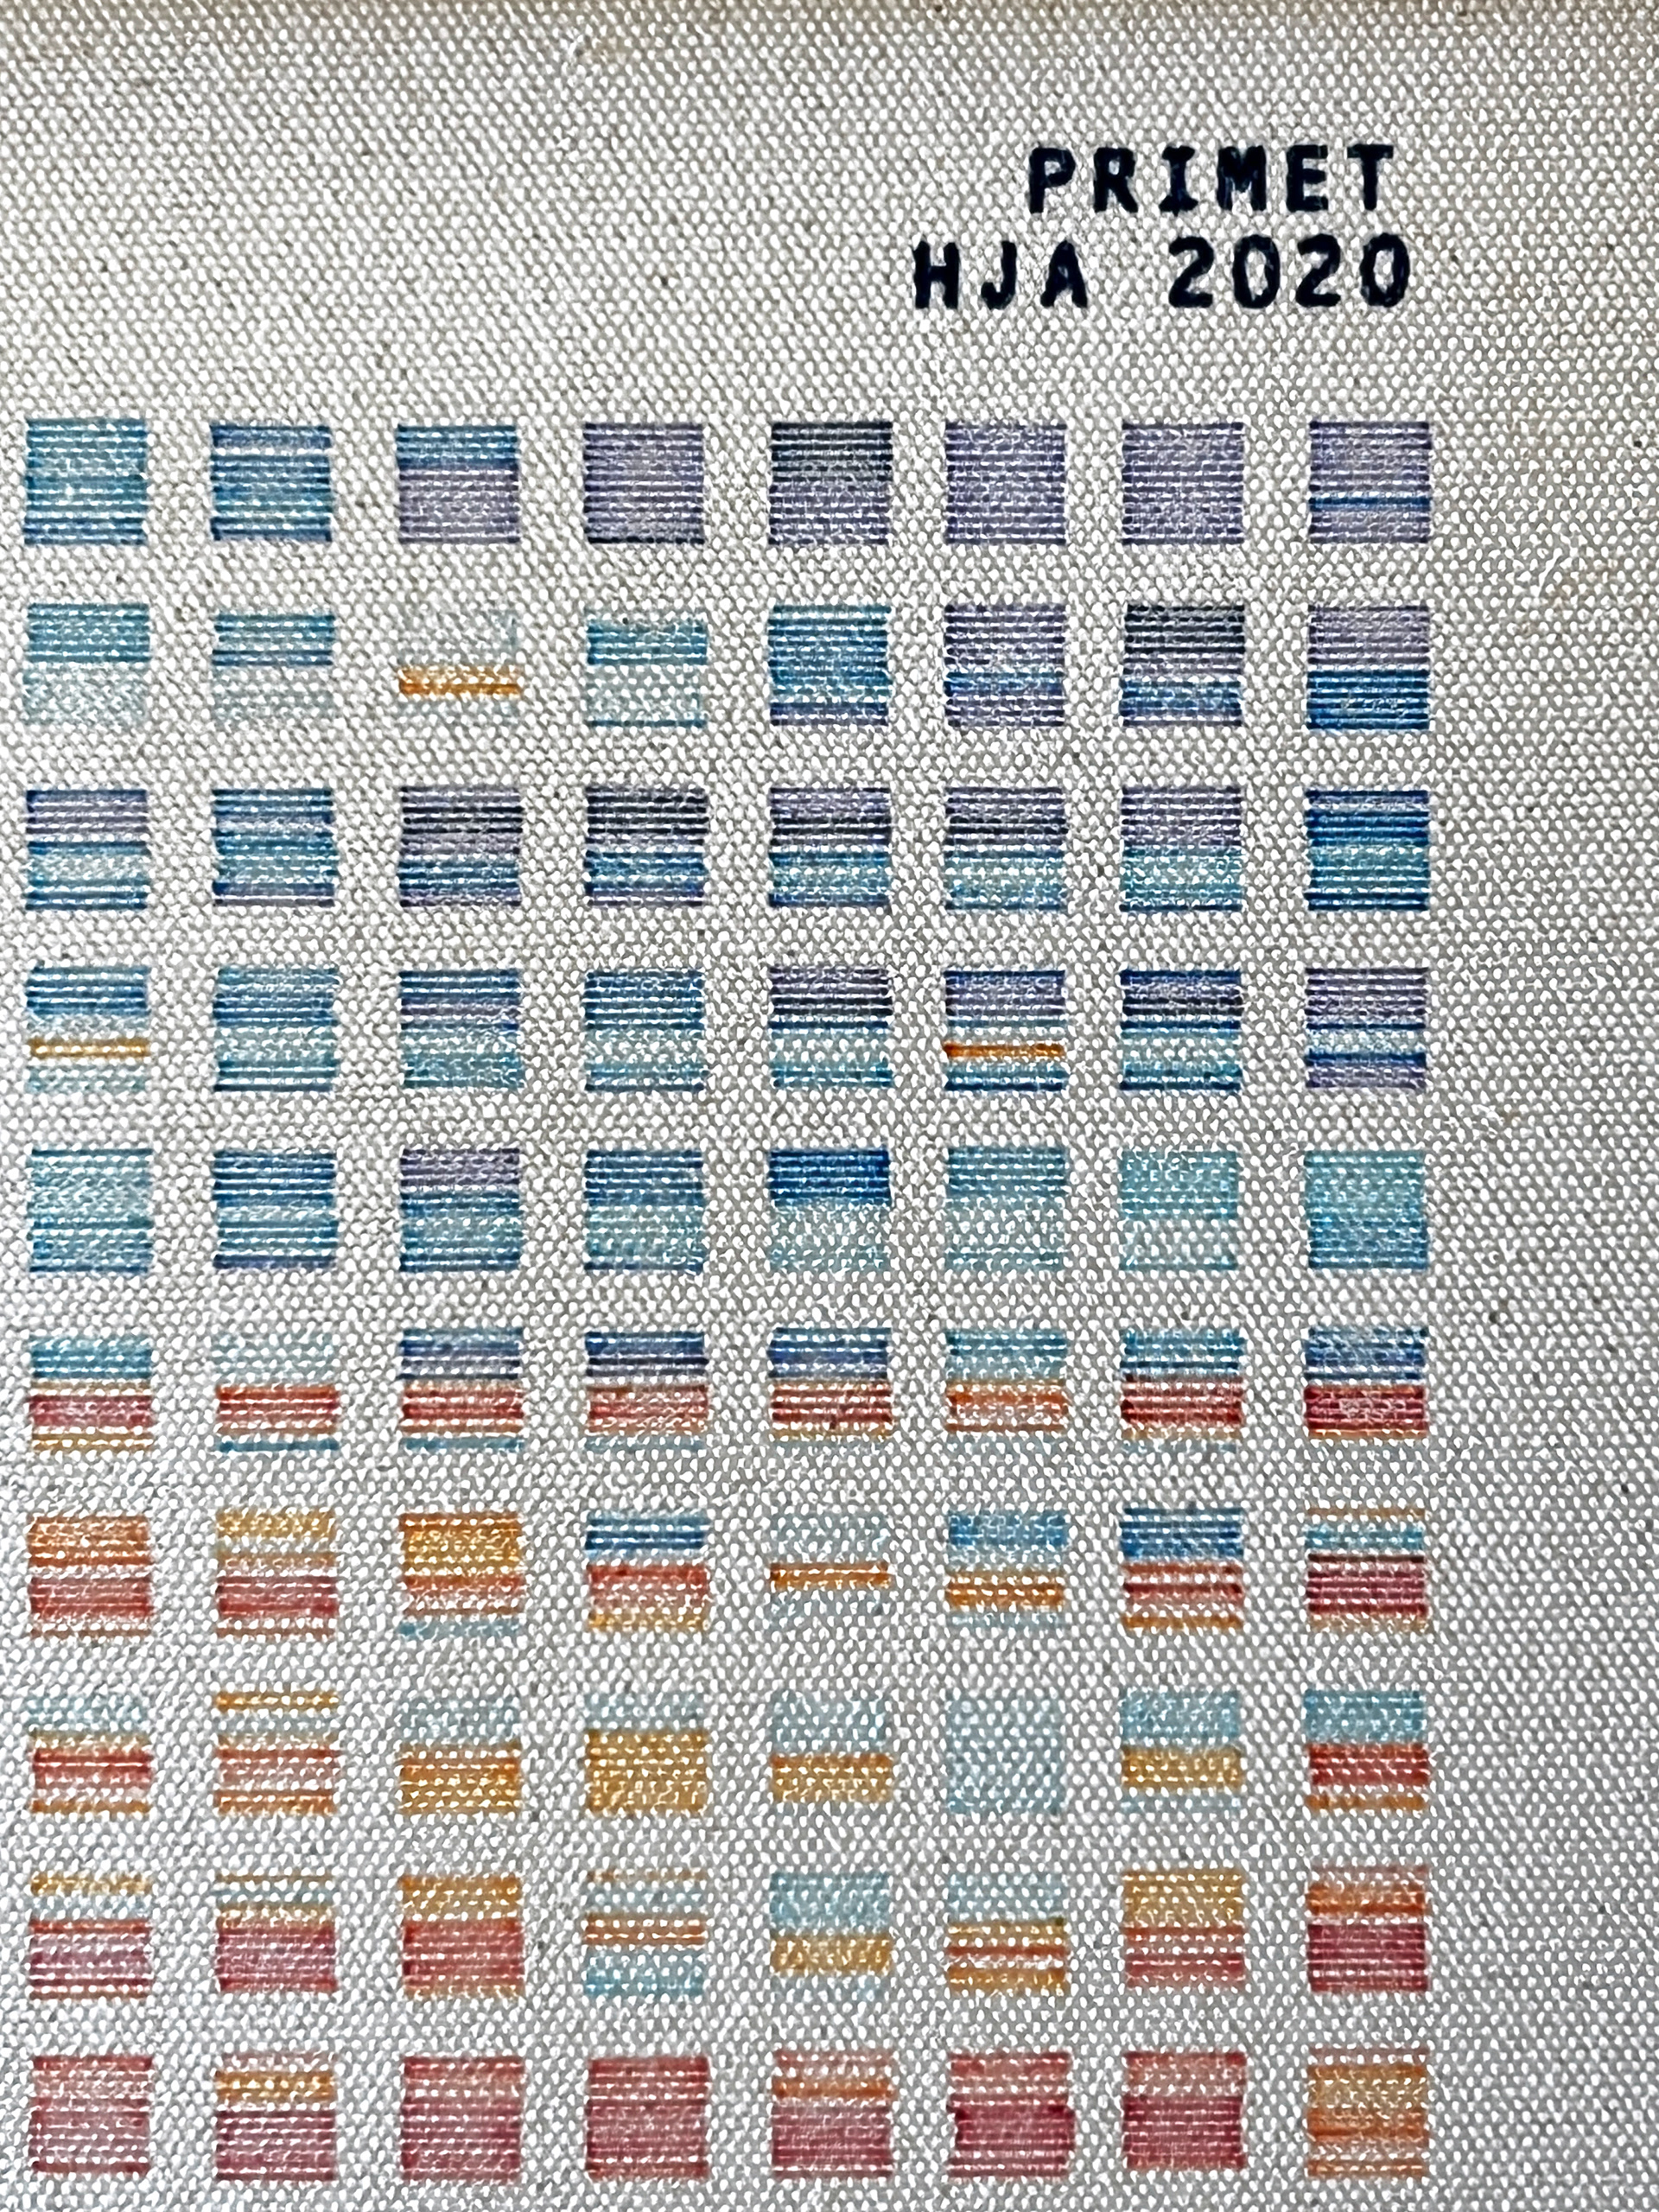
PRIMET Temperature Plot
Each cluster is a day of temperature data. Each cluster has 12 lines, one per every other hour. This was a year of (no longer standing) record temperatures, and high-intensity wildfires in this region.
Companion plot for the CFAR weather station. 14 color temperature gradient informed by HJ Andrews Experimental Forest for the year 2020.
Ink on heavy-body canvas, 14" x 18"
If interested in purchase, please email wheeel.130@gmail.com

