PRIMET Wind Speed and Direction
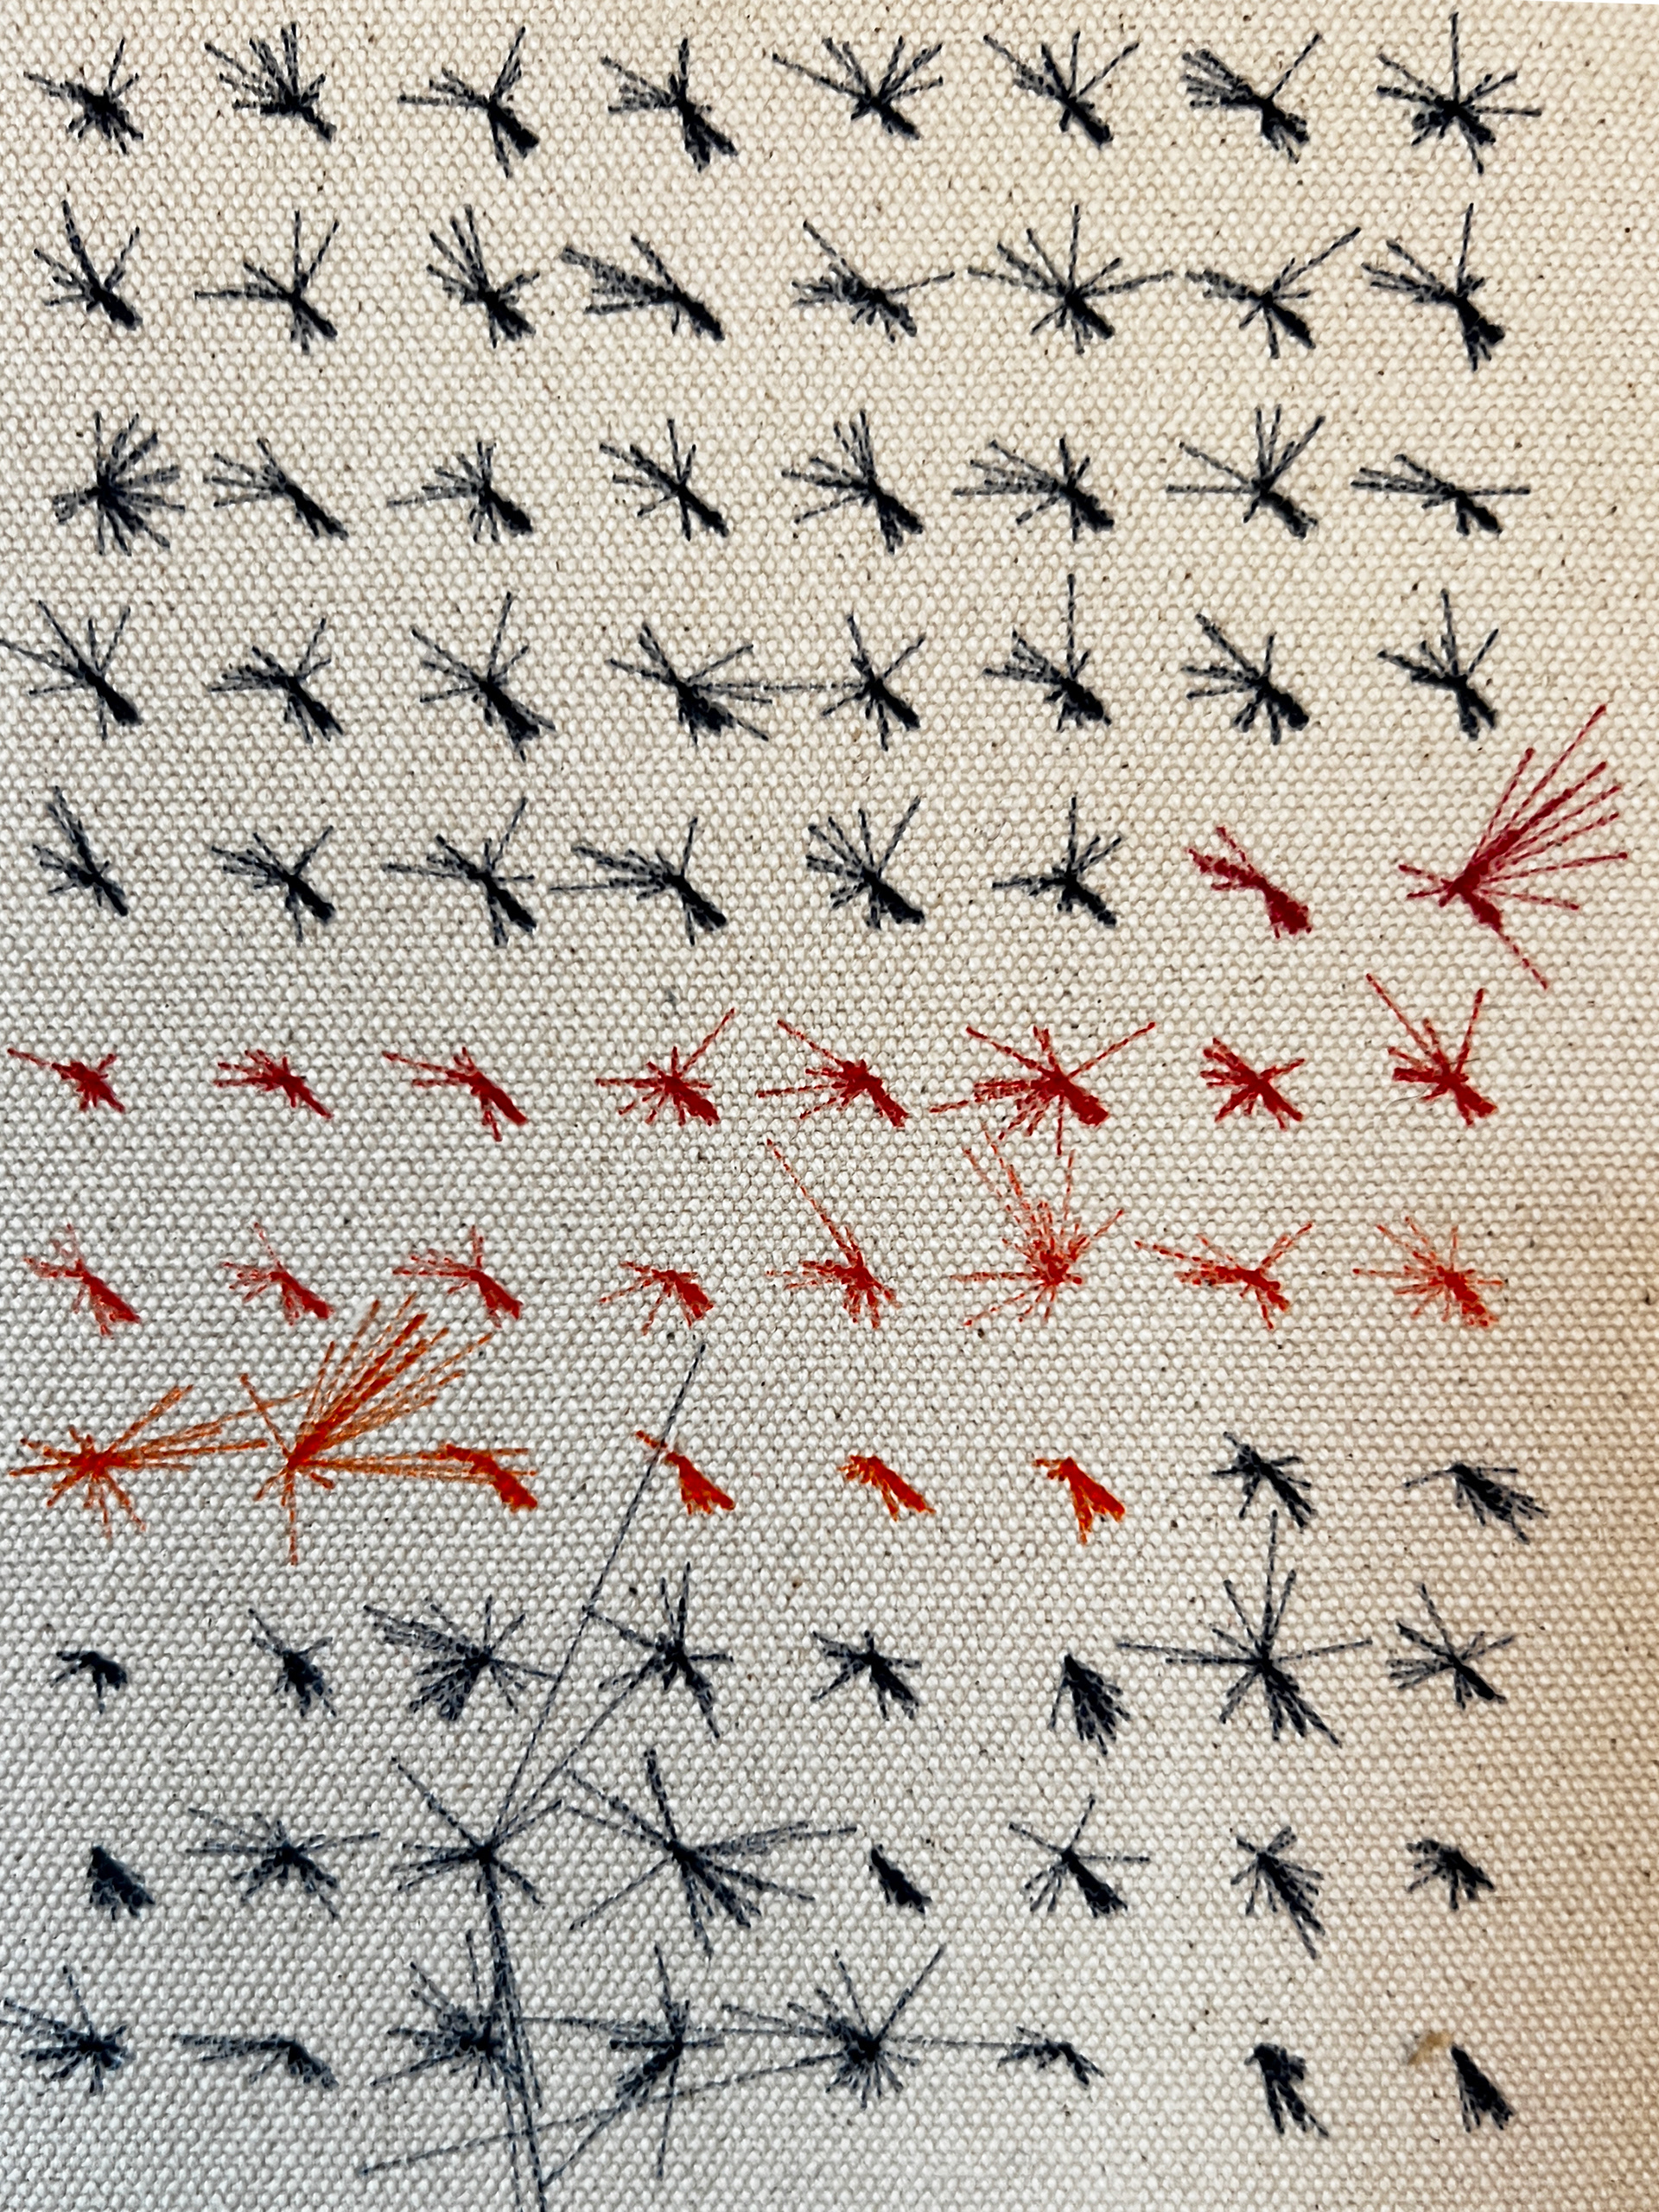
Each cluster represents 1 day of air movement. Each cluster has 24 lines, one per hour. The red shows the extreme easterly wind event that contributed to the Holiday Farm Fire. The color returns to black once the fire was extinguished.
Companion plot for the CFAR weather station. 6 color gradient informed by HJ Andrews Experimental Forest data for the year 2020.
Ink on heavy-body canvas, 14" x 18"
If interested in purchase, please email wheeel.130@gmail.com

